Source page: McKinsey & Company
Commentary
A tale of three US consumers
North America | Consumer | COVID-19
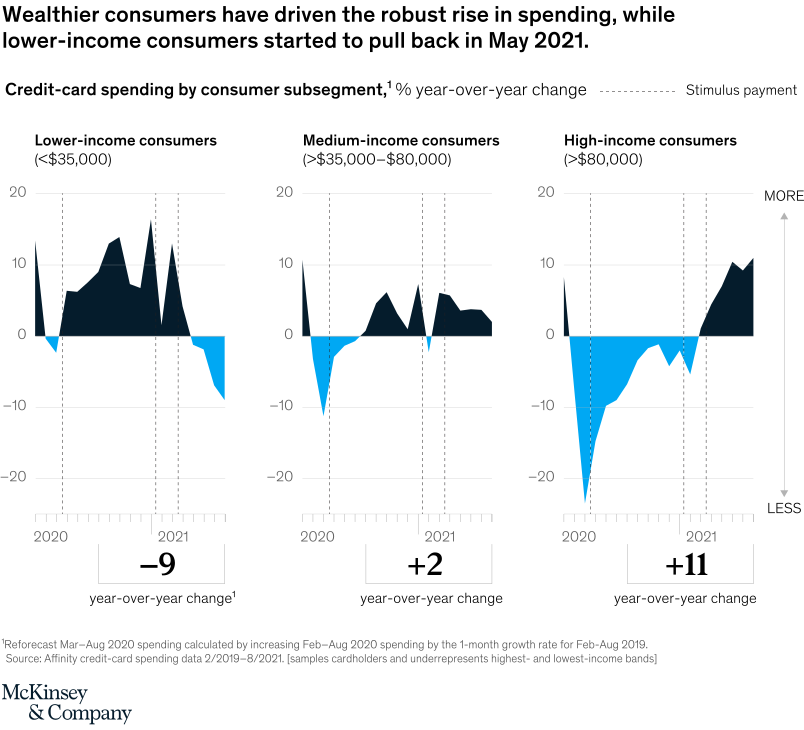
December 13, 2021 – In the depths of the pandemic, lower-income consumers accelerated their spending, while medium- and high-income consumers pulled back. More recently, those patterns have reversed.
To read the article, see “US consumer sentiment and behaviors during the coronavirus crisis,” October 18, 2021.
customizer here
Visual form
Three-panel area time-series chart.
Layout / body structure
The chart is arranged as three small-multiple panels for lower-income, medium-income, and high-income consumers. Reader scans left to right across the income tiers while following the same time window and the same zero baseline in each panel, with dashed vertical markers indicating stimulus-payment timing.
What is being compared
The chart compares year-over-year credit-card spending changes across three consumer-income segments. It is showing how lower-income, medium-income, and high-income consumers diverged in spending behavior through 2020 and into 2021.
Measurement system
The vertical scale is percent year-over-year change, centered on a zero line with positive territory above and negative territory below. Each panel also prints a summary figure beneath the chart, showing the recent year-over-year change for that income segment, while dashed vertical lines mark stimulus-payment moments in time.
Visible structure inside the graphic
Each panel uses dark fill above zero for positive spending growth and light blue fill below zero for declines. The three panels share the same time axis and visual rhythm, but their endpoints separate sharply, with the lower-income panel ending below zero, the medium-income panel hovering slightly above zero, and the high-income panel finishing well above zero.
Main takeaway from the visual
Higher-income consumers are driving the spending rebound, while lower-income consumers are pulling back. The difference is visible not just in the bottom summary boxes but in the shape of the panels themselves, where the high-income series climbs into sustained positive territory and the lower-income series turns negative again by the end.
Key standout values or extremes
The bottom summaries show negative 9 for lower-income consumers, positive 2 for medium-income consumers, and positive 11 for high-income consumers. The high-income panel also shows the sharpest early drop, sinking below negative 20 before rebounding, while the lower-income panel ends with the weakest final reading of the three groups.
Controls / sequence, when applicable
This is a static chart image with no in-chart controls to operate.
Companion media, when applicable
There is no separate companion audio or video; the chart image is the full visual on this page.