Source page: McKinsey & Company
Commentary
A taste for home delivery
Retail | E-commerce
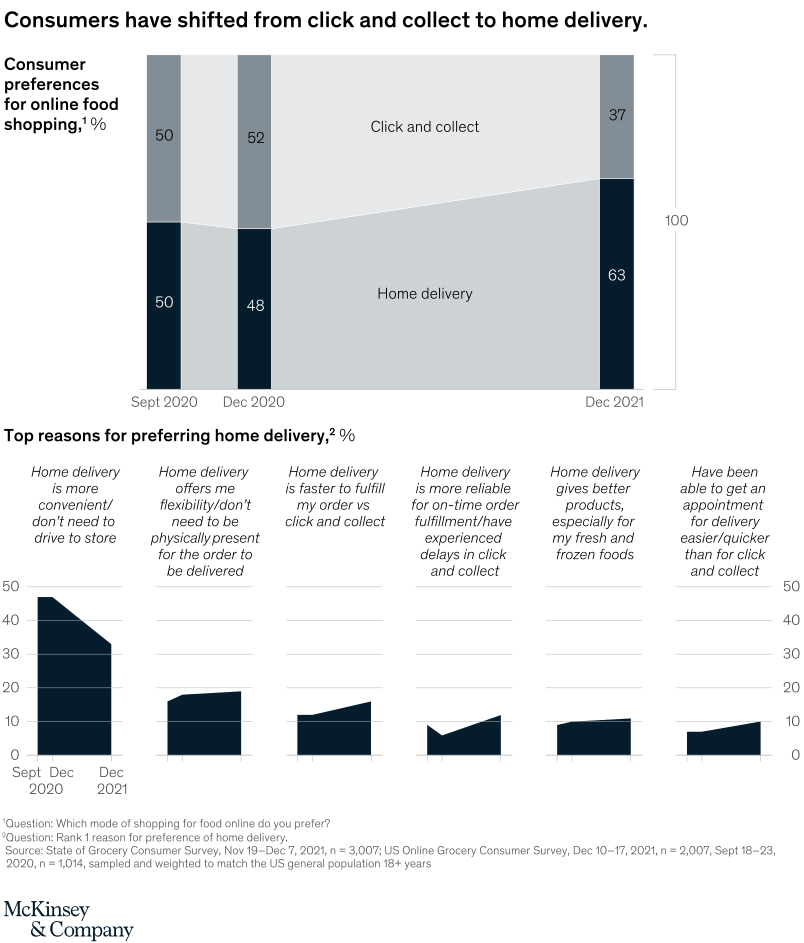
May 26, 2022 – The COVID-19 pandemic opened avenues of convenience for many grocery shoppers. And while some consumers are now comfortable with in-person activities, the popularity of grocery delivery hasn’t abated. According to our research, the preference for home delivery rose from 48 to 63 percent between December 2020 and December 2021.
To read the article, see “The next horizon for grocery e-commerce: Beyond the pandemic bump,” April 29, 2022.
customizer here
Visual form
Composite chart with a stacked preference display above six small multiples.
Layout / body structure
The graphic is split into two sections. Read the top section first, where three time points show the shift between click and collect and home delivery, then read the six smaller reason charts below from left to right.
What is being compared
The top section compares consumer preferences for online food shopping across September 2020, December 2020, and December 2021, separating click and collect from home delivery. The bottom section compares the leading reasons consumers prefer home delivery, including convenience, flexibility, faster fulfillment, reliability, better products, and easier appointment access.
Measurement system
The top section uses percentage share out of 100, with both home delivery and click and collect labeled directly inside the stacked columns. The bottom mini-charts use percentages on a shared vertical scale, so the heights and slopes show which reasons are strongest and how they changed over time.
Visible structure inside the graphic
At the top, three stacked columns are connected by slanted bands that show the move from a balanced split toward a delivery-led mix. Beneath that, six mini panels each carry a dark filled shape under an italic reason label, with the first panel visibly larger than the rest and the others clustered in the teens or low double digits.
Main takeaway from the visual
Home delivery gains clear ground over the period and becomes the dominant preferred mode by the last time point, while click and collect gives up share. The bottom row reinforces why: convenience stays the largest reason by a wide margin, and several secondary reasons add smaller but still visible support for delivery.
Key standout values or extremes
Home delivery moves from 50 percent in September 2020 to 48 percent in December 2020 and then up to 63 percent in December 2021, while click and collect moves from 50 to 52 and then down to 37. The strongest reason is that home delivery is more convenient and avoids the drive to the store, falling from the high 40s to the low 30s but still remaining the dominant reason; the next reasons sit much lower, generally in the high single digits to high teens.
Controls / sequence, when applicable
This is a static chart image with no in-chart controls to operate.
Companion media, when applicable
There is no separate companion audio or video; the chart image is the full visual on this page.