Source page: McKinsey & Company
Commentary
A used-car conundrum
Africa | Automotive | Mobility
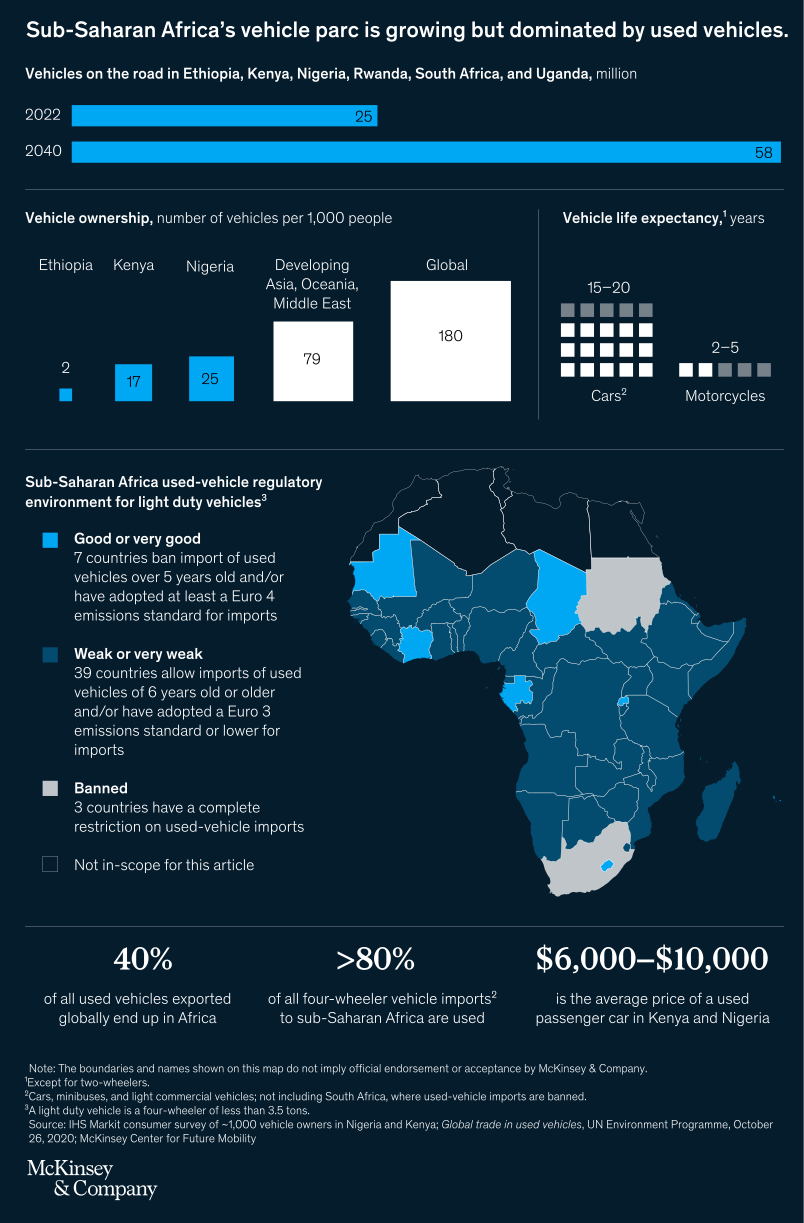
March 23, 2022 – The transition to electric mobility has accelerated in parts of sub-Saharan Africa. There are a few potential speed bumps, though: 40 percent of all used vehicles exported globally end up in Africa. Used vehicles tend to be more affordable—on average a used passenger car in Kenya and Nigeria costs $6,000 to $10,000, for example—but they often run on internal combustion engines (ICEs). Our article explores how electric vehicles (EVs) could scale in the region.
To read the article, see “Power to move: Accelerating the electric transport transition in sub-Saharan Africa,” February 23, 2022.
customizer here
Visual form
Regional category map.
Layout / body structure
The chart combines a legend block on the left with a choropleth-style map of Sub-Saharan Africa on the right. Reader takes the category definitions from the legend first and then moves across the map, matching each country’s fill color back to the regulatory category in the key.
What is being compared
The map compares countries in Sub-Saharan Africa by the strength of their used-vehicle import regulation for light-duty vehicles. It separates countries into good or very good, weak or very weak, banned, and not-in-scope regulatory environments.
Measurement system
This is a categorical map rather than a numeric axis chart. The measurement is the policy category represented by fill color, while the legend text explains the threshold behind each category, such as bans on older imported vehicles or the emissions standard used for imports.
Visible structure inside the graphic
The left legend lists four categories with matching color chips, and the right map uses those same fills across the region. Most countries are shaded in the dark weak-or-very-weak color, a smaller set appear in the brighter good-or-very-good color, a few countries are filled with the banned color, and some northern areas are left in the not-in-scope shade.
Main takeaway from the visual
The weak-or-very-weak category dominates the map, so the region reads as mostly permissive toward older used-vehicle imports rather than tightly regulated. The brighter good-or-very-good countries appear only in scattered pockets, and the fully banned category is rarer still.
Key standout values or extremes
The legend states that 39 countries fall in the weak-or-very-weak category, compared with only 7 in the good-or-very-good group and 3 with complete bans. Those category counts make the dark weak-regulation shade the overwhelming majority of the map.
Controls / sequence, when applicable
This is a static chart image with no in-chart controls to operate.
Companion media, when applicable
There is no separate companion audio or video; the chart image is the full visual on this page.