Source page: McKinsey & Company
Commentary
A wealth of opportunities
Financial services | Technology | Asia-Pacific
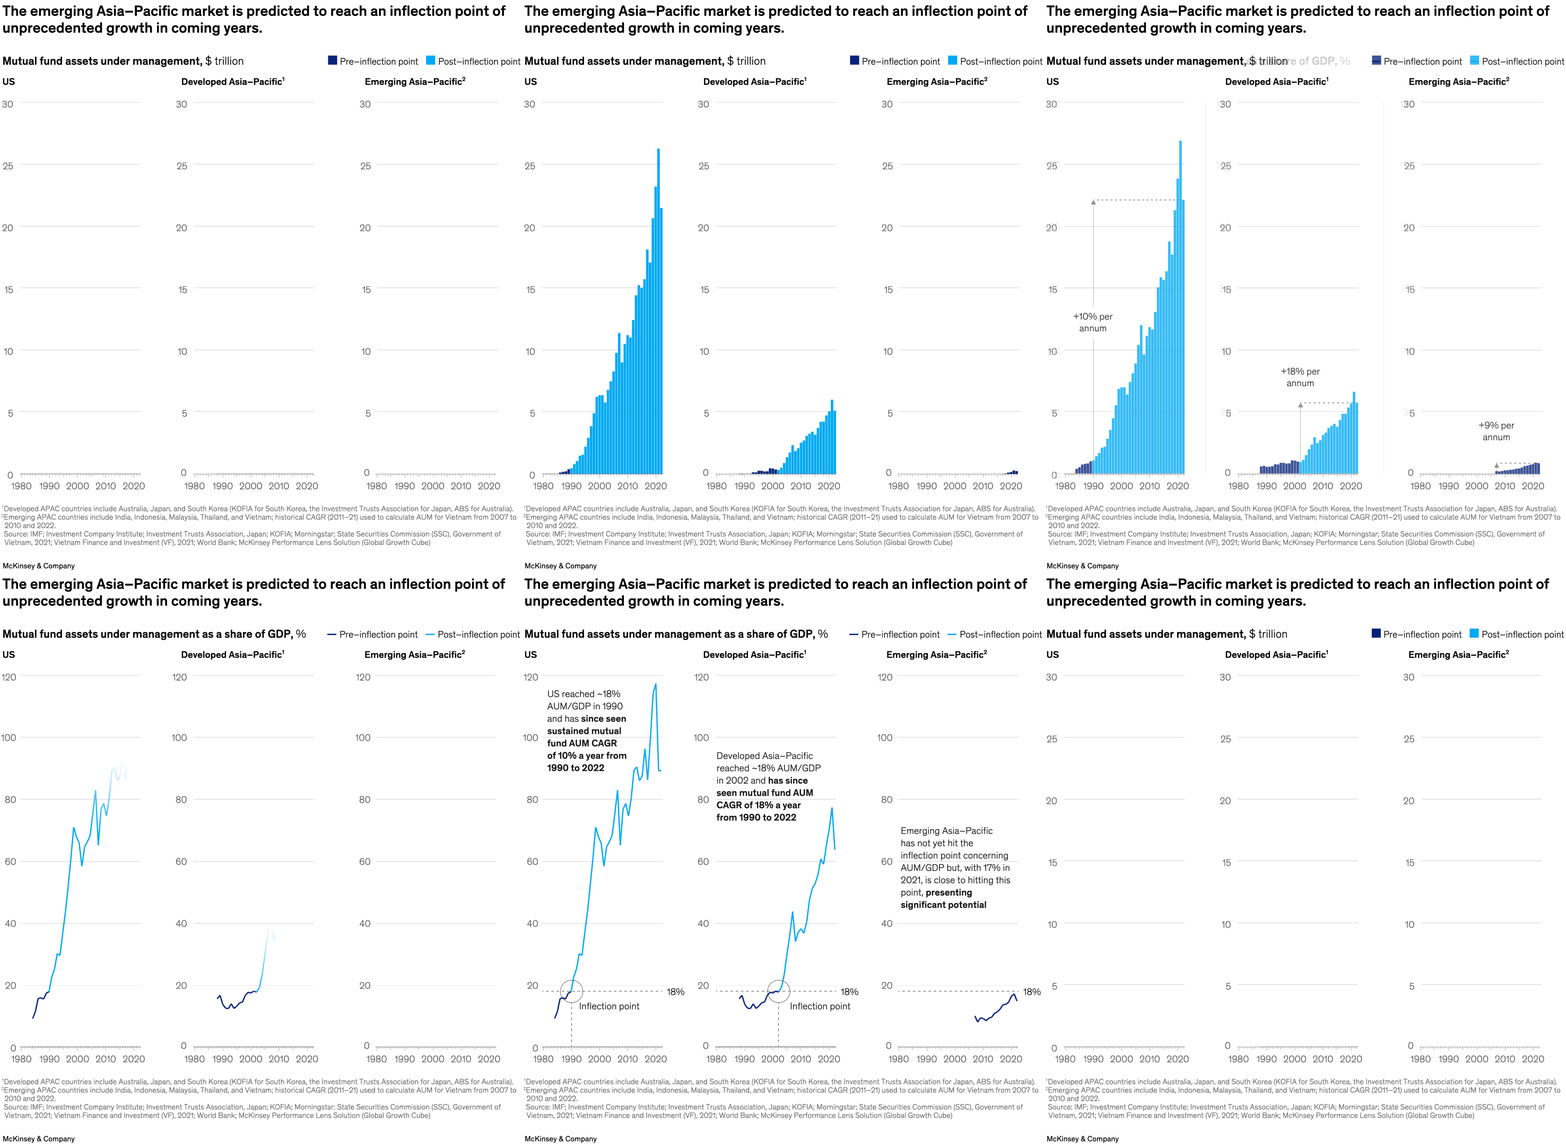
November 6, 2023 – The wealth management industry could be looking at significant opportunities in the Asia–Pacific region, note senior partners Bernhard Kotanko and Joydeep Sengupta and coauthors. In the same way the United States experienced a run of sustained growth in mutual fund assets under management, starting in the 1990s, both developed and emerging countries in the Asia–Pacific market could be on a similar trajectory. A set of technology platforms and tools could help wealth management companies tap the region’s potential upside.
To read the article, see “WealthTech in Asia–Pacific: The next frontier in financial innovation,” October 18, 2023.
customizer here
Visual form
Three-panel time-series comparison. Each panel tracks mutual fund assets under management over time and distinguishes a darker pre-inflection segment from a lighter post-inflection segment.
Layout / body structure
The chart is arranged left to right across three regional panels: the United States, developed Asia-Pacific, and emerging Asia-Pacific. Reader follows each line forward in time and compares where the inflection point appears and how steep the post-inflection growth becomes in each region.
What is being compared
The visual compares mutual fund assets under management across three regional markets and across pre-inflection versus post-inflection periods. It is designed to show how Asia-Pacific markets may follow a path similar to the United States but at different stages of maturity.
Measurement system
The chart is expressed first as trillions of dollars in the source framing and, in the animated panel view, as assets under management as a share of GDP in percentage terms. The lines are split by color so the reader can distinguish pre-inflection growth from the steeper post-inflection trajectory.
Visible structure inside the graphic
Each regional panel contains one continuous time path with a visible break between the darker early section and the brighter later section after the inflection point. The three side-by-side panels use the same time span, which makes it possible to compare how mature the United States and developed Asia-Pacific are versus how early emerging Asia-Pacific still is.
Main takeaway from the visual
Emerging Asia-Pacific is shown as being near the stage where growth can accelerate sharply rather than as a market that has already fully matured. The regional comparison makes that visible because the United States and developed Asia-Pacific already show long post-inflection climbs, while emerging Asia-Pacific sits much lower but close to the threshold highlighted in the annotations.
Key standout values or extremes
The source range notes that emerging Asia-Pacific had reached about 17 percent in 2021 and was close to its inflection point. In the comparative panels, the United States rises the highest and developed Asia-Pacific also climbs sharply after its break, while the emerging Asia-Pacific panel remains far lower but is positioned near the 18 percent threshold marker that signals potential takeoff.
Controls / sequence, when applicable
This is a static chart image with no in-chart controls to operate.
Companion media, when applicable
There is no separate companion audio or video; the chart image is the full visual on this page.