Source page: McKinsey & Company
Commentary
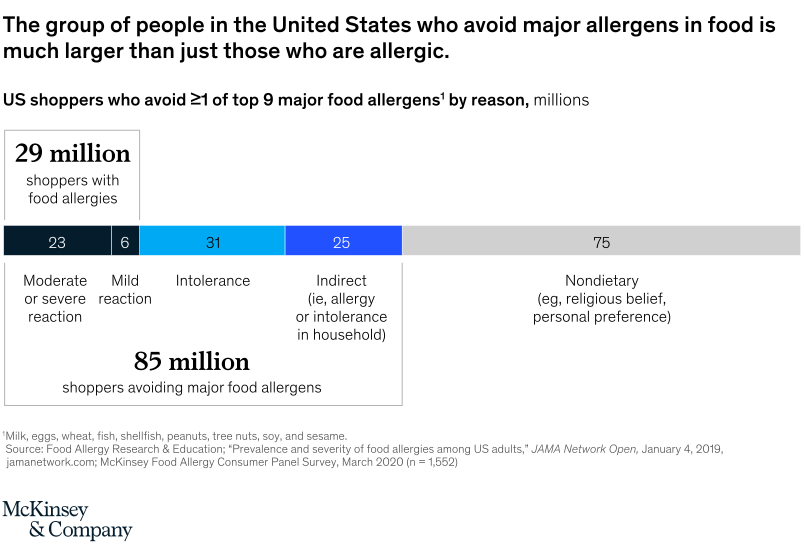
About 85 million Americans avoid a top-nine food allergen when grocery shopping
Consumer | Retail | Food
September 29, 2020 – And that number includes only those whose households are affected by some type of intolerance. Another 75 million Americans avoid milk, eggs, wheat, fish, shellfish, peanuts, tree nuts, soy, or sesame for nondietary reasons.
To read the article, see “Consumers with food allergies: A growing market remains underserved,” September 22, 2020.
customizer here
Visual form
Single KPI / Metric: 85-million shopper-allergen-avoidance callout with segmented reason counts.
Layout / body structure
The visual centers the total population of allergen-avoidant shoppers and surrounds it with reason categories. The reader starts with the 85 million total, then reads the counts for medical reactions, intolerance, household exposure, and nondietary avoidance.
What is being compared
It compares why US shoppers avoid one or more of the top nine food allergens, including moderate or severe reaction, mild reaction, intolerance, indirect household exposure, and nondietary reasons.
Measurement system
The measure is shoppers in millions. The reason counts overlap, so they should not be added as if they were mutually exclusive segments.
Visible structure inside the graphic
The total affected-shopper number is visually dominant, while smaller labeled counts explain how that population extends beyond people with medically severe allergies.
Main takeaway from the visual
The chart shows that allergen avoidance is a broad consumer behavior, not only a diagnosed-allergy issue. The shopper market includes intolerance, household spillover, and personal or religious avoidance.
Key standout values or extremes
The overall total is 85 million shoppers. The graphic also shows 23 million moderate or severe reactions, 6 million mild reactions, 31 million avoiding because of intolerance, 25 million indirect household avoiders, and 75 million nondietary avoiders.
Controls / sequence, when applicable
This is a static KPI-and-segment visual; there are no in-chart controls to operate.
Companion media, when applicable
There is no separate companion audio or video; the allergen-avoidance population visual is the full chart on this page.