Source page: McKinsey & Company
Commentary
Agentic AI advances
Artificial Intelligence | Technology | Healthcare
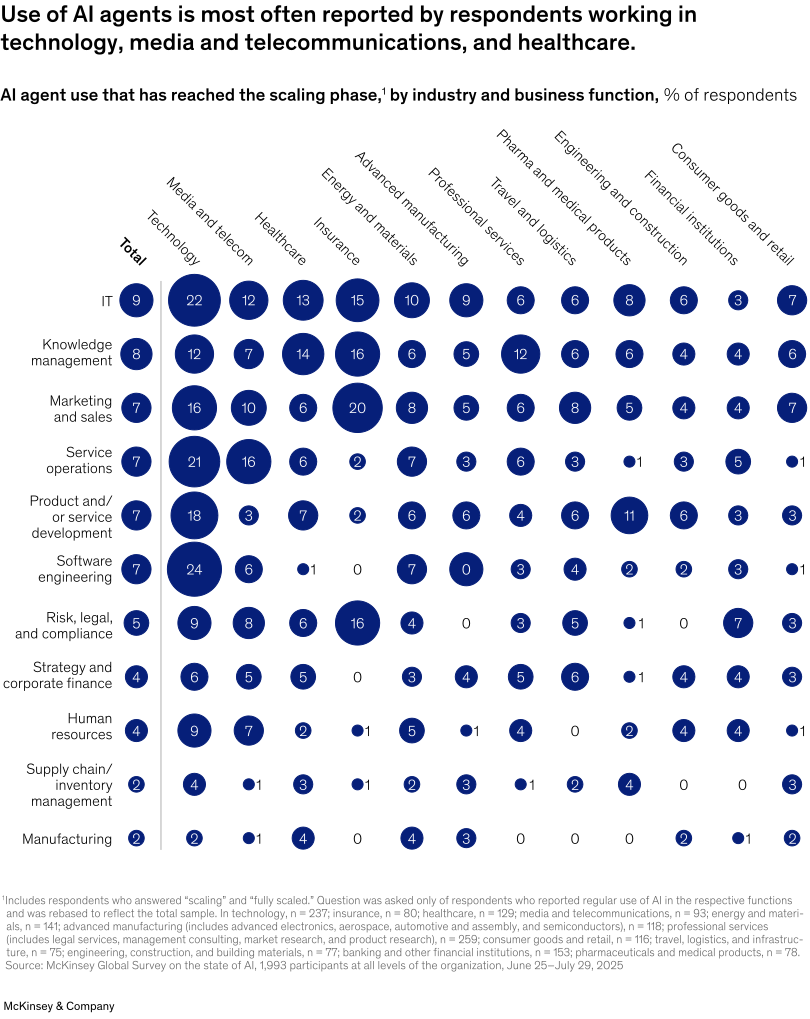
January 8, 2026 – AI is becoming widely used, but only a minority of companies are scaling more sophisticated capabilities, such as agents, into workstreams in ways that can transform their businesses. The adoption of AI agents at scale is most advanced in the technology industry, where functions including software engineering and IT report the highest levels of scaled use, McKinsey’s Alex Singla, Alexander Sukharevsky, Bryce Hall, Lareina Yee, Michael Chui, and coauthors note. Insurance leads in the use of AI agents for marketing and sales, while the healthcare industry shows strong uptake in knowledge management and IT.
To read the survey, see “The state of AI in 2025: Agents, innovation, and transformation,” November 5, 2025.
customizer here
Visual form
Table (with Visual Encoding): bubble-matrix table of scaled AI-agent use by business function and industry.
Layout / body structure
Rows list business functions, columns list industries, and each cell contains a percentage label with a size-coded bubble. A total column gives the all-industry baseline before the table moves across individual sectors.
What is being compared
It compares where AI-agent use has reached the scaling phase across functions and industries. The table lets the reader scan both which functions are further along and which industries report higher scaled use.
Measurement system
The measure is percent of respondents. Larger bubbles and larger numeric labels represent a higher share of respondents reporting scaled AI-agent use in that function-industry intersection.
Visible structure inside the graphic
The largest bubbles cluster in technology, media, and telecommunications, especially in software engineering, IT, and service operations. Healthcare also contains several larger cells, while many other industry-function intersections remain small or near zero.
Main takeaway from the visual
The chart shows that scaled AI-agent use is still uneven. It is most advanced in technology-related and service-heavy settings rather than evenly spread across every business function and industry.
Key standout values or extremes
Software engineering in technology reaches 24 percent, IT in technology reaches 22 percent, and service operations in technology reaches 21 percent. Healthcare also stands out, with service operations at 16 percent and IT at 12 percent, while many manufacturing and supply-chain cells sit around 0 to 4 percent.
Controls / sequence, when applicable
This is a static visually encoded bubble table; there are no in-chart controls to operate.
Companion media, when applicable
There is no separate companion audio or video; the AI-agent adoption bubble table is the full visual on this page.