Source page: McKinsey & Company
Commentary
AI transformers versus tinkerers
Artificial Intelligence | Innovation
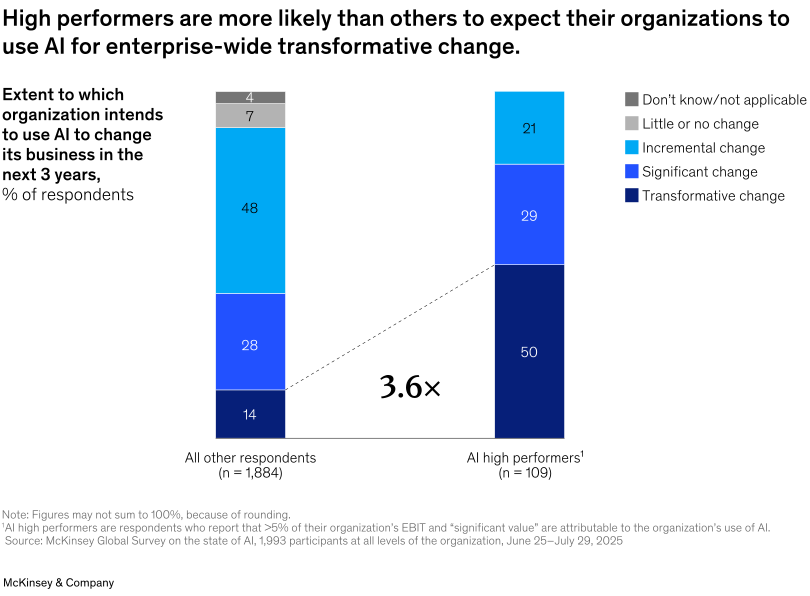
January 15, 2026 – Meaningful enterprise-wide impact from the use of AI is rare, but McKinsey survey results suggest that bold moves can yield big results. Organizations that are already AI high performers have much greater ambitions for the technology’s future impact. Half of these companies—defined as those that attribute at least 5 percent of EBIT to AI use—expect it to bring about transformative change to their business in the next three years, note McKinsey’s Alex Singla, Alexander Sukharevsky, Bryce Hall, Lareina Yee, Michael Chui, and coauthors. This is more than three and a half times the share of other companies, where a plurality of respondents expect only incremental changes from AI.
To read the survey, see “The state of AI in 2025: Agents, innovation, and transformation,” November 5, 2025.
customizer here
Visual form
Stacked bar chart.
Layout / body structure
The chart is organized as two vertical stacked columns placed side by side, with all other respondents on the left and AI high performers on the right. It reads left to right across the two groups, with the legend on the right clarifying the stack order and a diagonal connector pointing to the larger transformative segment on the high-performer side.
What is being compared
It compares how two respondent groups expect AI to change their organizations over the next three years. Within each bar it compares five response levels: don’t know or not applicable, little or no change, incremental change, significant change, and transformative change.
Measurement system
The scale is percentage of respondents, and each stack sums to 100 percent with slight rounding. Color separates the five response bands, while the large 3.6x label quantifies the difference in the transformative-change share between the two groups.
Visible structure inside the graphic
Each bar is divided into five colored segments, from the darkest transformative block at the base through significant and incremental change to the lighter no-change and don’t-know bands near the top. The legend anchors those categories, and the dashed connector visually links the two transformative segments to the 3.6x callout in the middle.
Main takeaway from the visual
The chart shows that AI high performers expect much deeper organization-wide change than everyone else. Their bar is dominated by the transformative and significant segments, while the bar for all other respondents is dominated by incremental change and contains a much smaller transformative base.
Key standout values or extremes
Transformative change is 50 percent for AI high performers versus 14 percent for all other respondents, which drives the 3.6x comparison shown in the center. Incremental change moves the other way, accounting for 48 percent among all other respondents but only 21 percent among high performers.
Controls / sequence, when applicable
This is a static chart image with no in-chart controls to operate.
Companion media, when applicable
There is no separate companion audio or video; the chart image is the full visual on this page.