Source page: McKinsey & Company
Commentary
AI wings for fleet fixes
Aerospace | Artificial Intelligence
September 25, 2024 – This week, our charts feature the latest insights in aviation—from soaring fleet demands to landing the right talent and more.
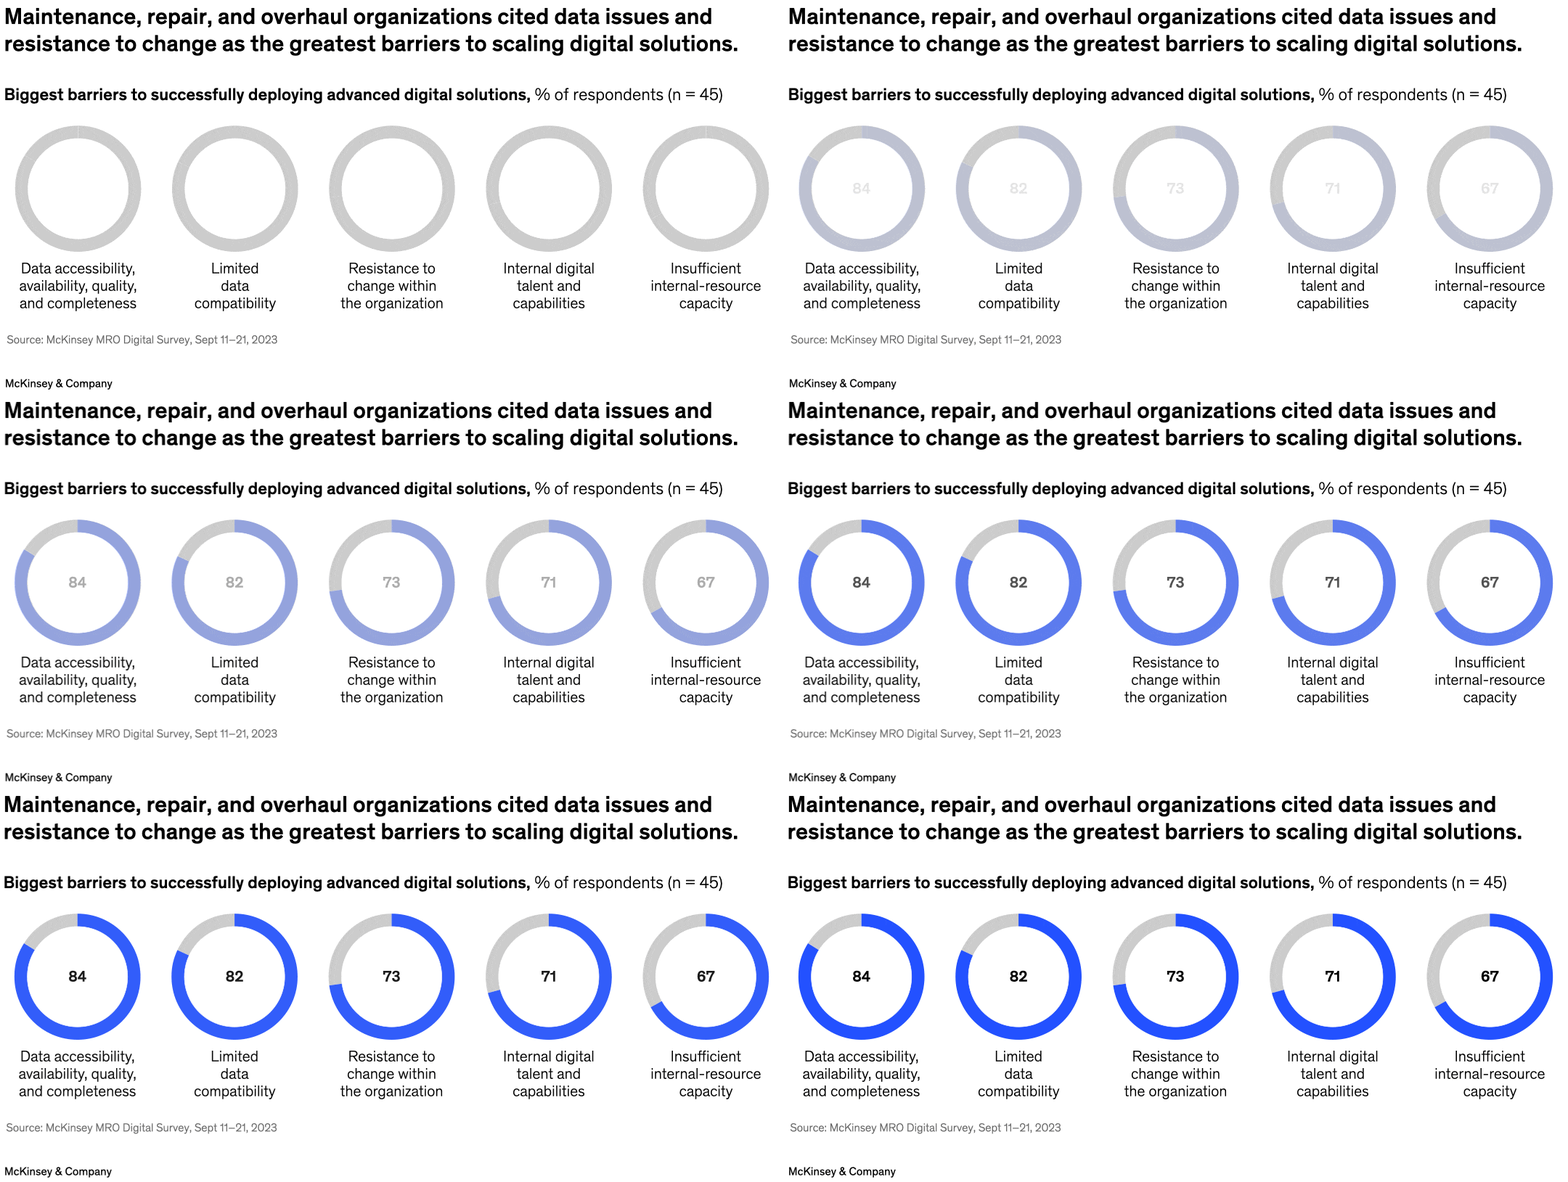
Airlines across the globe are facing the reality that fleet maintenance has gotten tougher. New approaches are needed for maintenance, repair, and overhaul organizations, and a McKinsey survey indicates AI-powered advances could help, say senior partner Vik Krishnan and colleagues. There are challenges, however, and more than 80 percent of respondents say data limitations are the biggest hurdle to seizing the AI opportunity. Organizational resistance to change and the lack of internal digital talent also hinder scaling digital capabilities.
To read the article, see “Aircraft MRO 2.0: The digital revolution,” July 19, 2024.
customizer here
Visual form
Donut-chart sequence.
Layout / body structure
The chart is a single row of five donut charts, each representing one deployment barrier. It is read left to right across the barrier labels, with the largest percentages appearing first.
What is being compared
It compares the biggest barriers maintenance, repair, and overhaul organizations cite when trying to deploy advanced digital solutions, ranking the obstacles by the share of respondents who selected them.
Measurement system
The reader tracks percentages printed in the center of each donut. The blue portion represents the share citing that barrier, while the light remainder completes the ring to 100 percent.
Visible structure inside the graphic
Each obstacle is shown as a circular ring with the numeric value centered inside and the barrier label placed directly underneath. Because every donut uses the same size and format, differences are conveyed through the size of the colored arc and the value in the middle.
Main takeaway from the visual
The graphic shows the barriers clustering around data problems and organizational friction rather than one isolated technical issue. Data accessibility and compatibility sit at the top, but resistance to change, internal talent gaps, and limited internal capacity are also large enough to look like systemic blockers.
Key standout values or extremes
Data accessibility, availability, quality, and completeness is highest at 84 percent, followed by limited data compatibility at 82 percent. Resistance to change scores 73 percent, internal digital talent and capabilities 71 percent, and insufficient internal-resource capacity 67 percent.
Controls / sequence, when applicable
This is a static chart image with no in-chart controls to operate.
Companion media, when applicable
There is no separate companion audio or video; the chart image is the full visual on this page.