Source page: McKinsey & Company
Commentary
Airline values in a tailspin
Travel | Logistics | Infrastructure
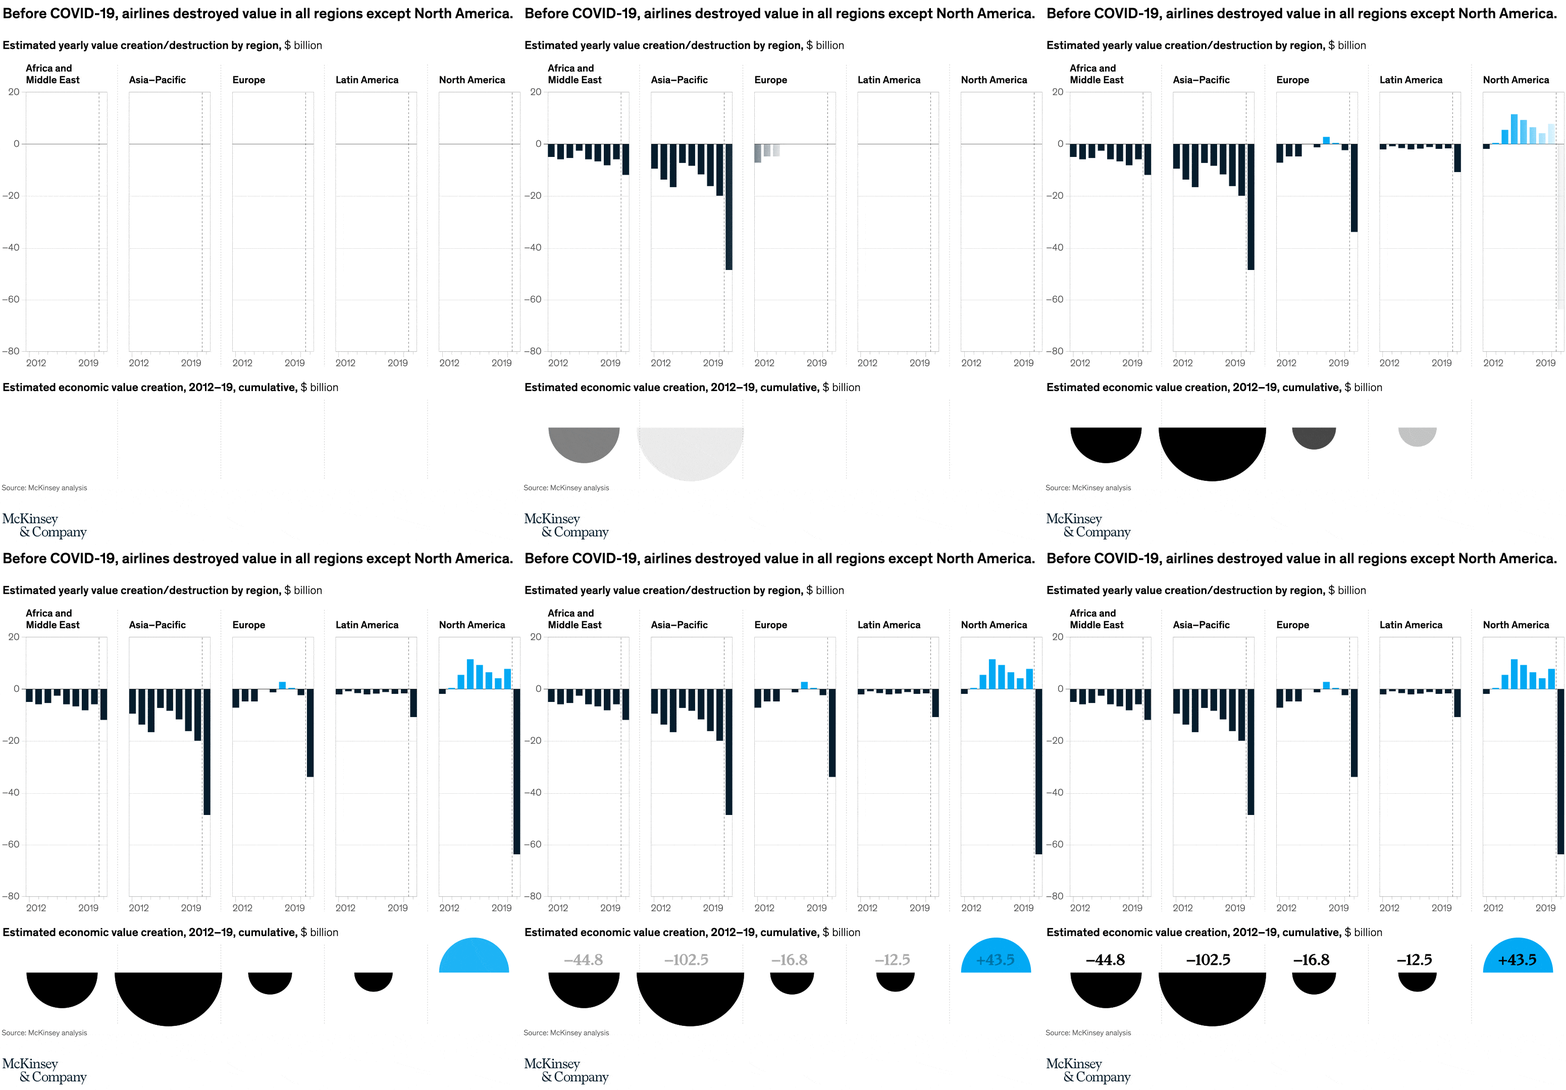
April 28, 2022 – Even before COVID-19, airlines outside North America struggled with losses. Between 2012 and 2019, airlines were bleeding $17 billion in economic profit per year. In 2020, as the pandemic affected air travel demand, airlines lost $168 billion, setting the aviation subsector back roughly 16 years. North America was not spared in 2020, either, registering $63 billion in losses.
To read the article, see “Taking stock of the pandemic’s impact on global aviation,” March 31, 2022.
customizer here
Visual form
Regional small-multiples column chart with cumulative summary badges.
Layout / body structure
The chart is laid out as five regional mini-charts across the top and one aligned row of cumulative summary shapes beneath them. Read the yearly columns within each region first, then drop down to the bottom row to compare the total value created or destroyed across the same regions.
What is being compared
The page compares airline value creation and destruction across Africa and the Middle East, Asia-Pacific, Europe, Latin America, and North America. It compares annual regional performance in the upper row and cumulative regional performance in the lower row.
Measurement system
The upper charts measure estimated yearly value creation or destruction in billions of dollars, using bars above zero for positive years and bars below zero for negative years. The lower row condenses cumulative 2012 to 2019 value creation into one direct number and a half-circle magnitude marker for each region.
Visible structure inside the graphic
Each region gets its own vertical strip of yearly bars with a shared zero line and matching scale, which makes the cross-region comparison easy to scan left to right. The bottom row then turns those histories into one bold figure per region, with black semicircles for negative cumulative value and a blue semicircle for the one positive outlier.
Main takeaway from the visual
North America is the only region that shows sustained positive value creation before the pandemic, while every other region sits on the destructive side of the ledger. That contrast is reinforced twice: North America is the only top panel with a run of blue positive bars, and it is the only bottom summary with a positive cumulative badge.
Key standout values or extremes
The cumulative row shows Asia-Pacific at negative 102.5 billion dollars, Africa and the Middle East at negative 44.8, Europe at negative 16.8, and Latin America at negative 12.5, while North America stands alone at positive 43.5. In the upper row, the non-North American regions are mostly below zero, whereas North America posts several positive yearly bars before the sharp downturn at the far right.
Controls / sequence, when applicable
This is a static chart image with no in-chart controls to operate.
Companion media, when applicable
There is no separate companion audio or video; the chart image is the full visual on this page.