Source page: McKinsey & Company
Commentary
Airlines’ sputtering recovery
Aerospace | Travel & Transportation
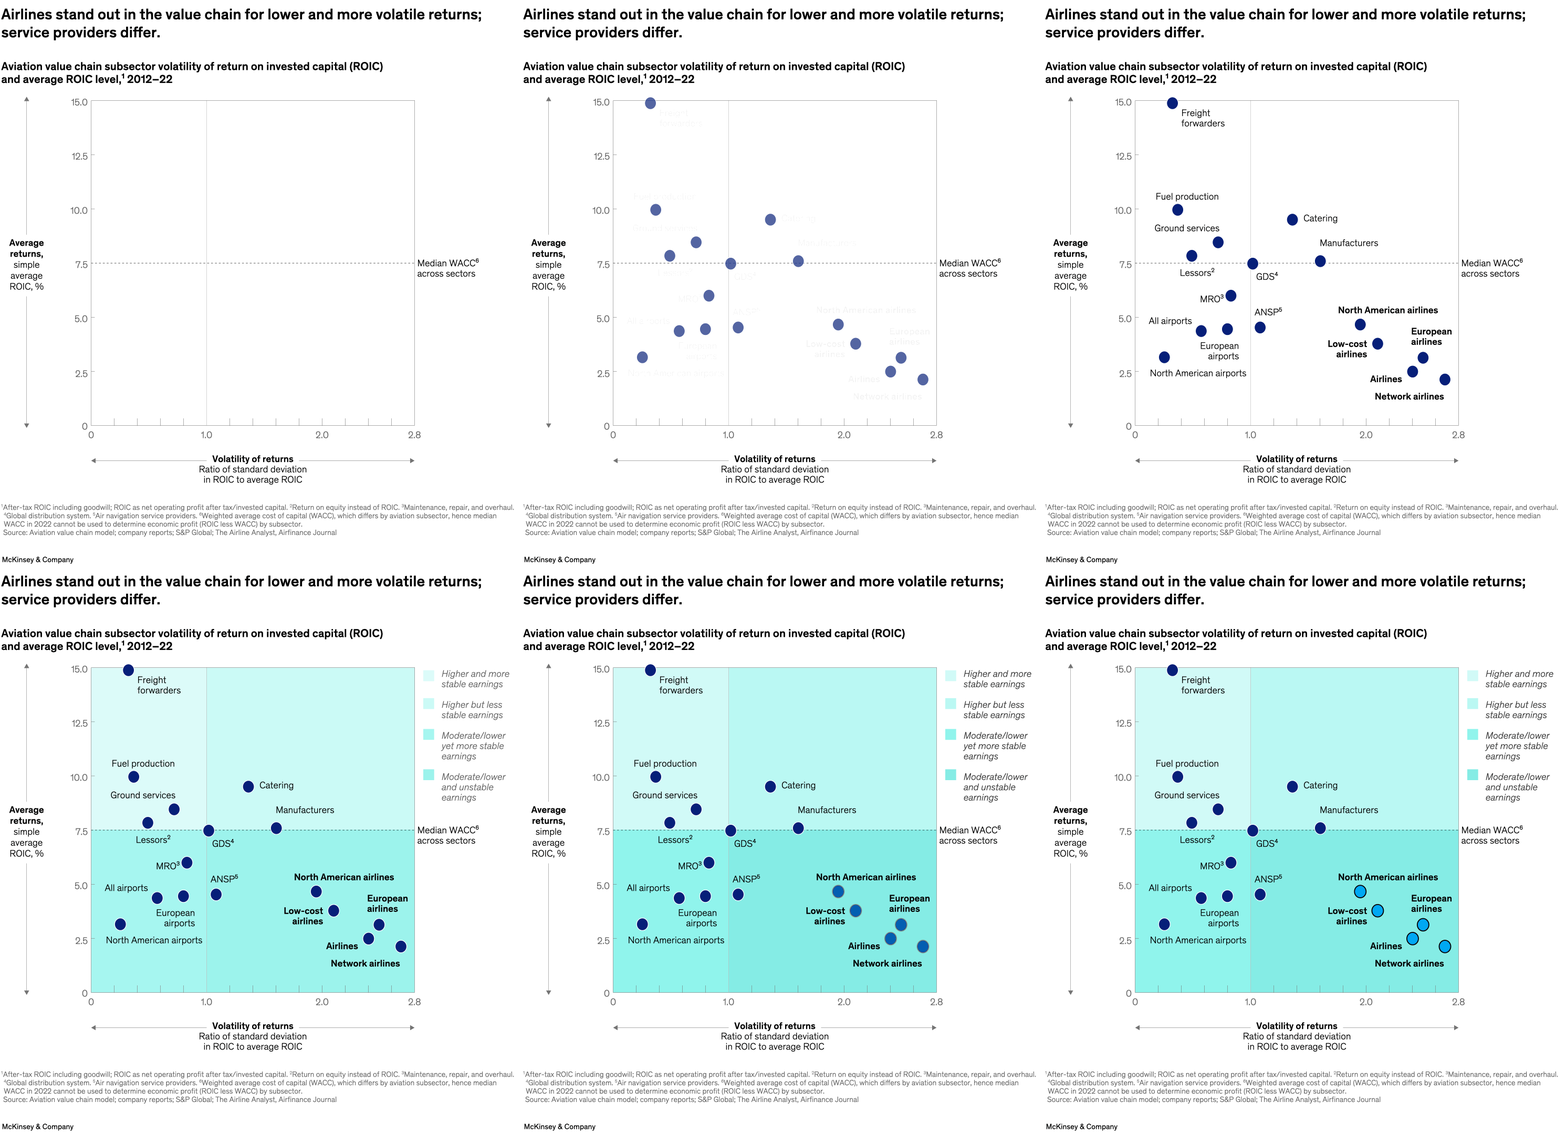
November 13, 2023 – The aviation industry continues to recover from pandemic-related declines, although overall losses have shrunk from $159 billion in 2021 to $69 billion last year. Partner Vik Krishnan and coauthors note that airlines in particular have lower and more volatile returns compared with other subsectors in the aviation value chain, such as fuel production and ground services. This is due in part to airlines’ high exposure to external shocks.
To read the article, see “Checking in on the aviation value chain’s recovery,” October 25, 2023.
customizer here
Visual form
Quadrant-style scatter plot. Each point represents an aviation value-chain subsector and is positioned by average return on invested capital and volatility of returns.
Layout / body structure
The plot is read on two axes: average returns on the vertical axis and volatility of returns on the horizontal axis. A dashed horizontal median-WACC line and the shaded background quadrants help the reader see which subsectors combine higher or lower returns with more or less stability.
What is being compared
The visual compares aviation subsectors such as freight forwarders, fuel production, ground services, catering, manufacturers, airports, lessors, navigation service providers, MRO, and several airline categories. It compares them simultaneously on return level and return volatility rather than on only one financial metric.
Measurement system
The vertical axis is simple average ROIC in percent and the horizontal axis is the ratio of standard deviation in ROIC to average ROIC. Point position, not point size, carries the measurement, and the dashed line marks the approximate median WACC benchmark across sectors.
Visible structure inside the graphic
The chart is made of labeled dots positioned inside four shaded quadrants that correspond to more or less stable earnings and higher or lower returns. The airline clusters sit low and far to the right, while freight forwarders and several service or industrial categories occupy higher-return positions with differing levels of volatility.
Main takeaway from the visual
Airlines are visually separated from much of the rest of the value chain by combining low returns with high volatility. The scatter layout makes that pattern unmistakable because the airline points cluster in the lower-right portion of the chart while higher-return subsectors such as freight forwarders, fuel production, and catering sit higher up.
Key standout values or extremes
Freight forwarders sits near 15 percent ROIC with very low volatility, making it one of the strongest points on the chart. Network airlines, European airlines, and low-cost airlines sit far to the right with average ROIC mostly in the low single digits, while North American airlines are only modestly higher on returns and remain highly volatile.
Controls / sequence, when applicable
This is a static chart image with no in-chart controls to operate.
Companion media, when applicable
There is no separate companion audio or video; the chart image is the full visual on this page.