Source page: McKinsey & Company
Commentary
Airlines’ value on an upward trend
Travel & Transportation | Growth
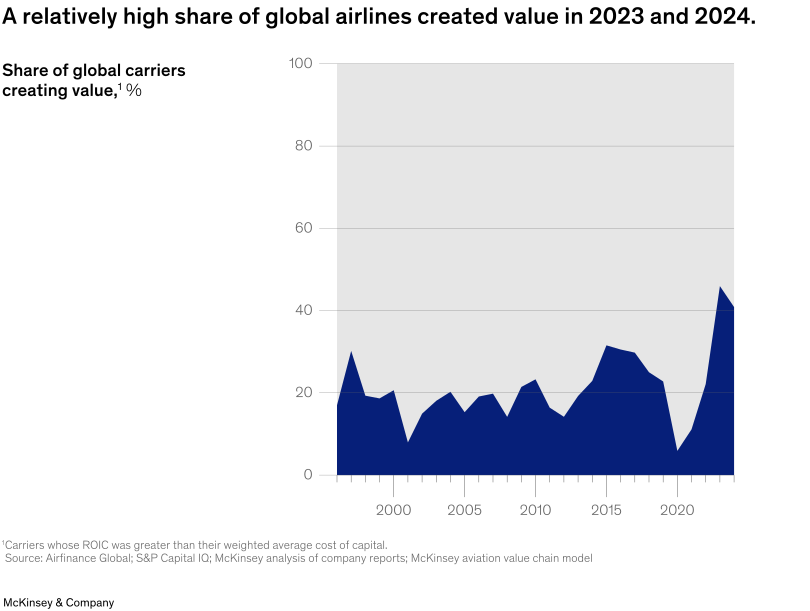
July 17, 2025 – Airline operators face frequent challenges, from weather events to shifting travel habits to economic uncertainty. Creating value under such circumstances can be a tall order. Many carriers, however, performed well in 2023, and 2024 data indicate another decent year, explain Partner Steve Saxon and coauthors. The number of airlines that generated value reached historic highs in 2023 and 2024, at 46 percent and 41 percent of airlines analyzed, respectively. Airlines that created value were defined as those whose return on invested capital was greater than their weighted average cost of capital.
To read the article, see “Can the global airline industry continue its climb?,” May 22, 2025.
customizer here
Visual form
Time-series area chart.
Layout / body structure
The chart is a single historical chart read left to right across the airline cycle. One filled dark-blue area tracks the share of global carriers creating value over time against a 0 to 100 percent scale.
What is being compared
It compares the annual share of global carriers whose return on invested capital exceeded their weighted average cost of capital, spanning the late 1990s through 2024.
Measurement system
The vertical axis uses percentage share, and the horizontal axis marks time by year with major ticks around 2000, 2005, 2010, 2015, and 2020. The area height at each point indicates the share of carriers creating value in that year.
Visible structure inside the graphic
The blue filled area starts around the high teens, fluctuates through the early 2000s, rises into the low 30s in the mid-2010s, collapses to a low single-digit trough around 2020, and then surges sharply into the mid-40s before easing slightly to roughly 41 by the end. The empty space above the filled area makes the swings in carrier performance especially visible.
Main takeaway from the visual
The chart shows that the share of airlines creating value improved materially in the most recent two years after the severe pandemic-era drop. The late-series upswing is the most visually dramatic movement on the chart.
Key standout values or extremes
The recent peak reaches about 46 percent before ending near 41 percent, which matches the article’s point that 2023 and 2024 were unusually strong years. The weakest point is the pandemic-era trough around 2020, when the share drops to roughly 6 percent.
Controls / sequence, when applicable
This is a static chart image with no in-chart controls to operate.
Companion media, when applicable
There is no separate companion audio or video; the chart image is the full visual on this page.