Source page: McKinsey & Company
Commentary
All chips are on the table
Semiconductors | Supply Chain Management
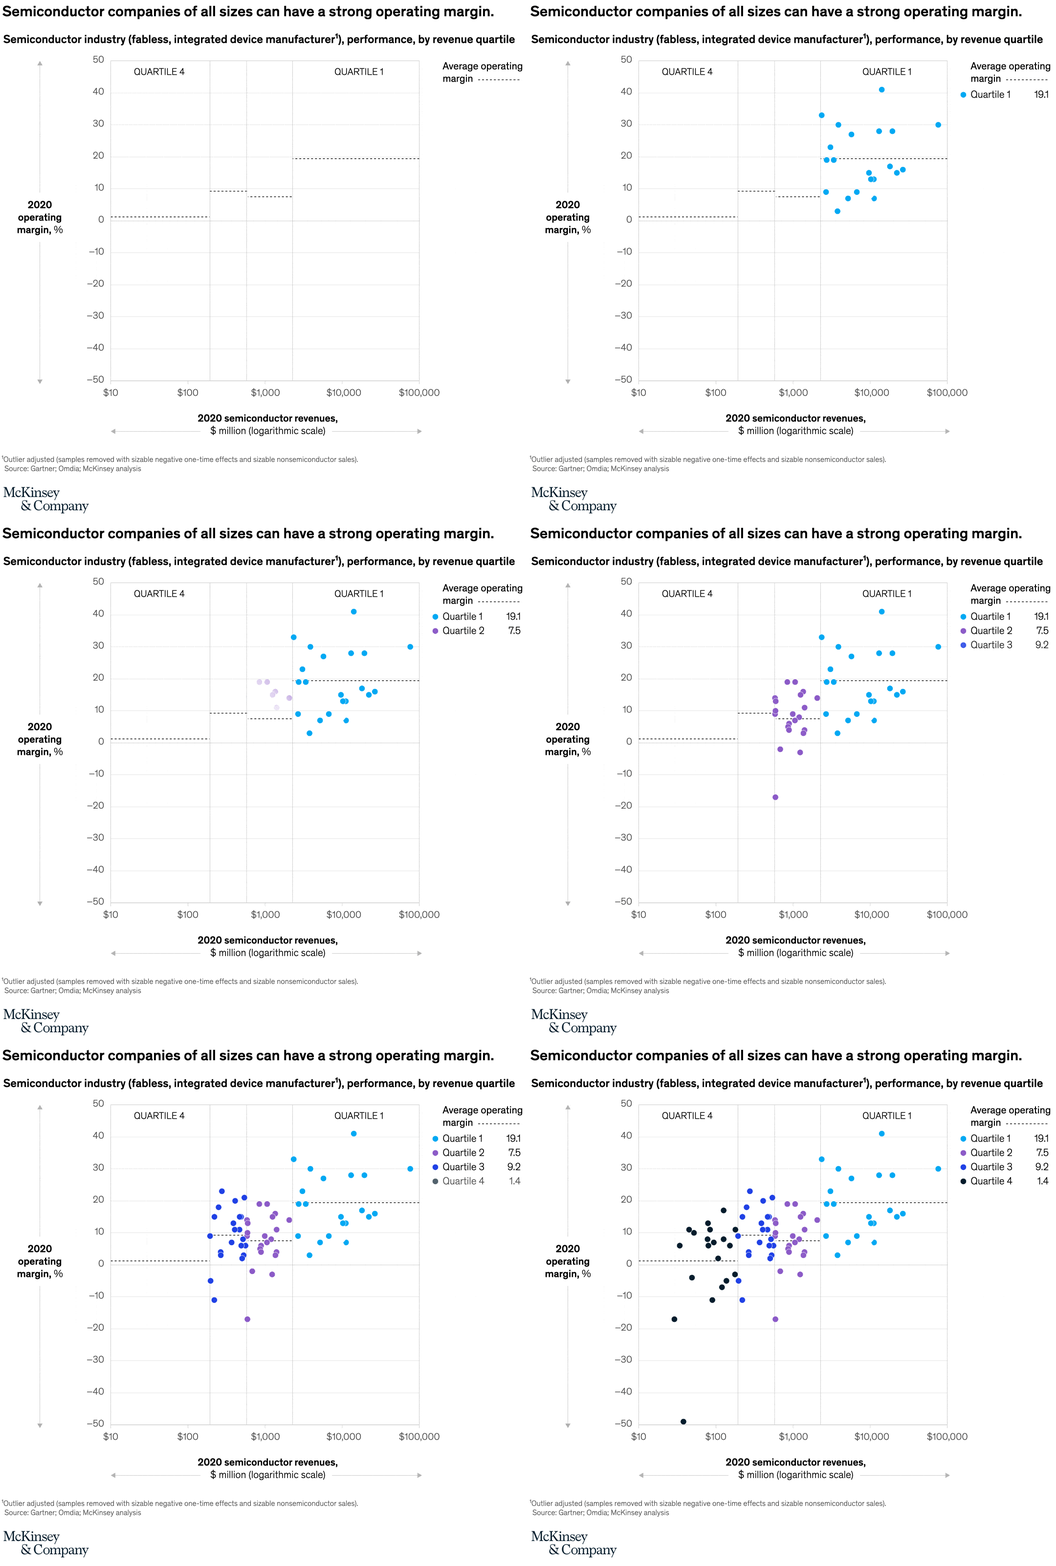
May 20, 2022 – With demand for chips continuing to outstrip supply, strong growth is possible for all semiconductor companies, regardless of size. While quartile 1 shows that the largest companies generate the greatest profits, our analysis also found small, niche players with high operating margins.
To read the article, see “Strategies to lead in the semiconductor world,” April 15, 2022.
customizer here
Visual form
Scatter plot.
Layout / body structure
The chart is a single scatter field on Cartesian axes. Read it left to right by company size and bottom to top by operating margin, using the color groupings to compare clusters rather than following a single line.
What is being compared
The chart compares semiconductor companies by scale and profitability at the same time. Each point represents a company, so the reader is comparing company revenue on one axis against operating margin on the other while also seeing how different company groupings occupy different parts of the field.
Measurement system
The horizontal axis measures 2017 semiconductor revenue in millions of dollars, and the vertical axis measures EBIT percentage as the operating-margin scale. Color separates the point clusters into company groupings, and the chart also marks an average-margin reference line across the field.
Visible structure inside the graphic
The scatter contains one broad cluster of light-blue points spread across the mid-to-right side of the chart and denser darker clusters lower and farther left, with a few points extending toward the highest margins. Grid lines, the average-margin marker, and the separation between left-side and right-side clusters make it possible to compare not only who is biggest but who sits well above the profitability baseline.
Main takeaway from the visual
The visual shows that strong operating margins are not confined to the very largest semiconductor companies. Large companies do occupy the right side of the revenue scale, but many smaller and midsize companies still sit high on the margin axis, so profitability is spread across multiple size bands rather than being concentrated only at the top end of revenue.
Key standout values or extremes
The revenue axis stretches from very small companies at the far left to companies above roughly $60 billion on the far right, while the margin axis runs from losses below zero up to margins around 40 percent. The most profitable points sit high on the chart in more than one revenue band, while the lowest-margin points cluster low on the left side of the field.
Controls / sequence, when applicable
This is a static chart image with no in-chart controls to operate.
Companion media, when applicable
There is no separate companion audio or video; the chart image is the full visual on this page.