Source page: McKinsey & Company
Commentary
Aluminum recycling roadblocks
Decarbonization | Metals and mining | Sustainability
September 18, 2025 – Expanding secondary aluminum production is crucial to achieving net-zero emissions goals, given that recycling aluminum uses significantly less energy than primary production. A large portion of aluminum scrap comes from postconsumer sources, but much of it ends up in mixed scrap pools, where it later becomes downcycled and high-value alloys are left unrecovered, explain Partner Peter Spiller and colleagues. To tap the recycled aluminum market, addressing collection and sorting bottlenecks could help to recover more high-value alloys and boost recycling rates.
To read the article, see “Cleaning up mixed scrap: Decarbonizing aluminum through circularity,” July 24, 2025.
customizer here
Visual form
Treemap-style block chart with side callouts.
Layout / body structure
The page uses one central composition chart, read from the left callout into the main block area and then across to the right-hand category notes. The top gray strip sits above the postconsumer blocks and the smaller right-side segments subdivide the lower chart.
What is being compared
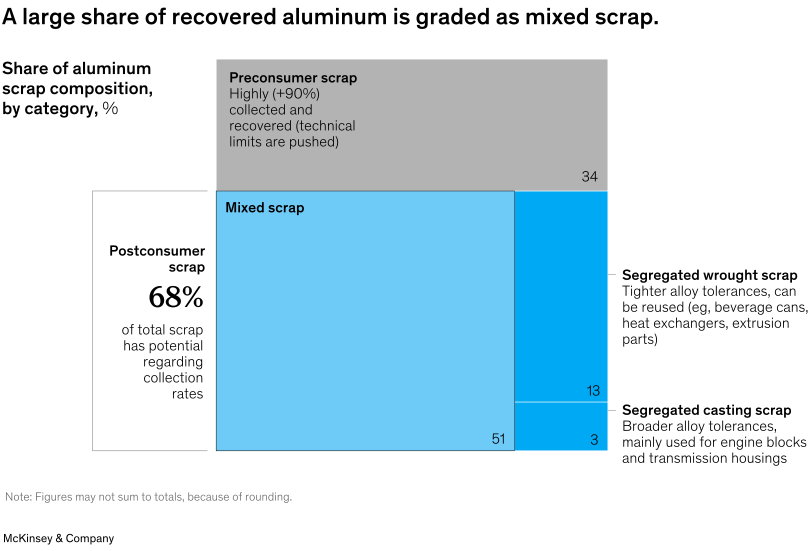
It compares the composition of aluminum scrap by category, separating postconsumer scrap from preconsumer scrap and then splitting the postconsumer share into mixed scrap, segregated wrought scrap, and segregated casting scrap.
Measurement system
The units are percentage shares of aluminum scrap composition. The chart labels the main blocks directly with values, so the reader tracks proportions rather than a continuous axis.
Visible structure inside the graphic
A boxed callout on the left states that postconsumer scrap accounts for 68 percent of total scrap with potential collection-rate gains. The main composition field is divided into a gray preconsumer band labeled 34 on top, a large light-blue mixed-scrap block labeled 51 below, and two smaller darker-blue blocks on the right labeled 13 and 3 for segregated wrought and segregated casting scrap. The right margin adds text notes explaining the reuse profile of those segregated streams.
Main takeaway from the visual
The chart shows that most recoverable aluminum sits in the mixed-scrap pool rather than in cleaner, more reusable segregated streams, which makes high-value alloy recovery harder and turns collection and sorting into the real bottleneck.
Key standout values or extremes
The largest single block is mixed scrap at 51 percent, far bigger than segregated wrought scrap at 13 percent and segregated casting scrap at 3 percent. The left-side callout also emphasizes that postconsumer scrap makes up 68 percent of total scrap, while preconsumer scrap accounts for 34 percent.
Controls / sequence, when applicable
This is a static chart image with no in-chart controls to operate.
Companion media, when applicable
There is no separate companion audio or video; the chart image is the full visual on this page.