Source page: McKinsey & Company
Commentary
An economic boom is coming. But what could go wrong?
COVID-19 | Economy
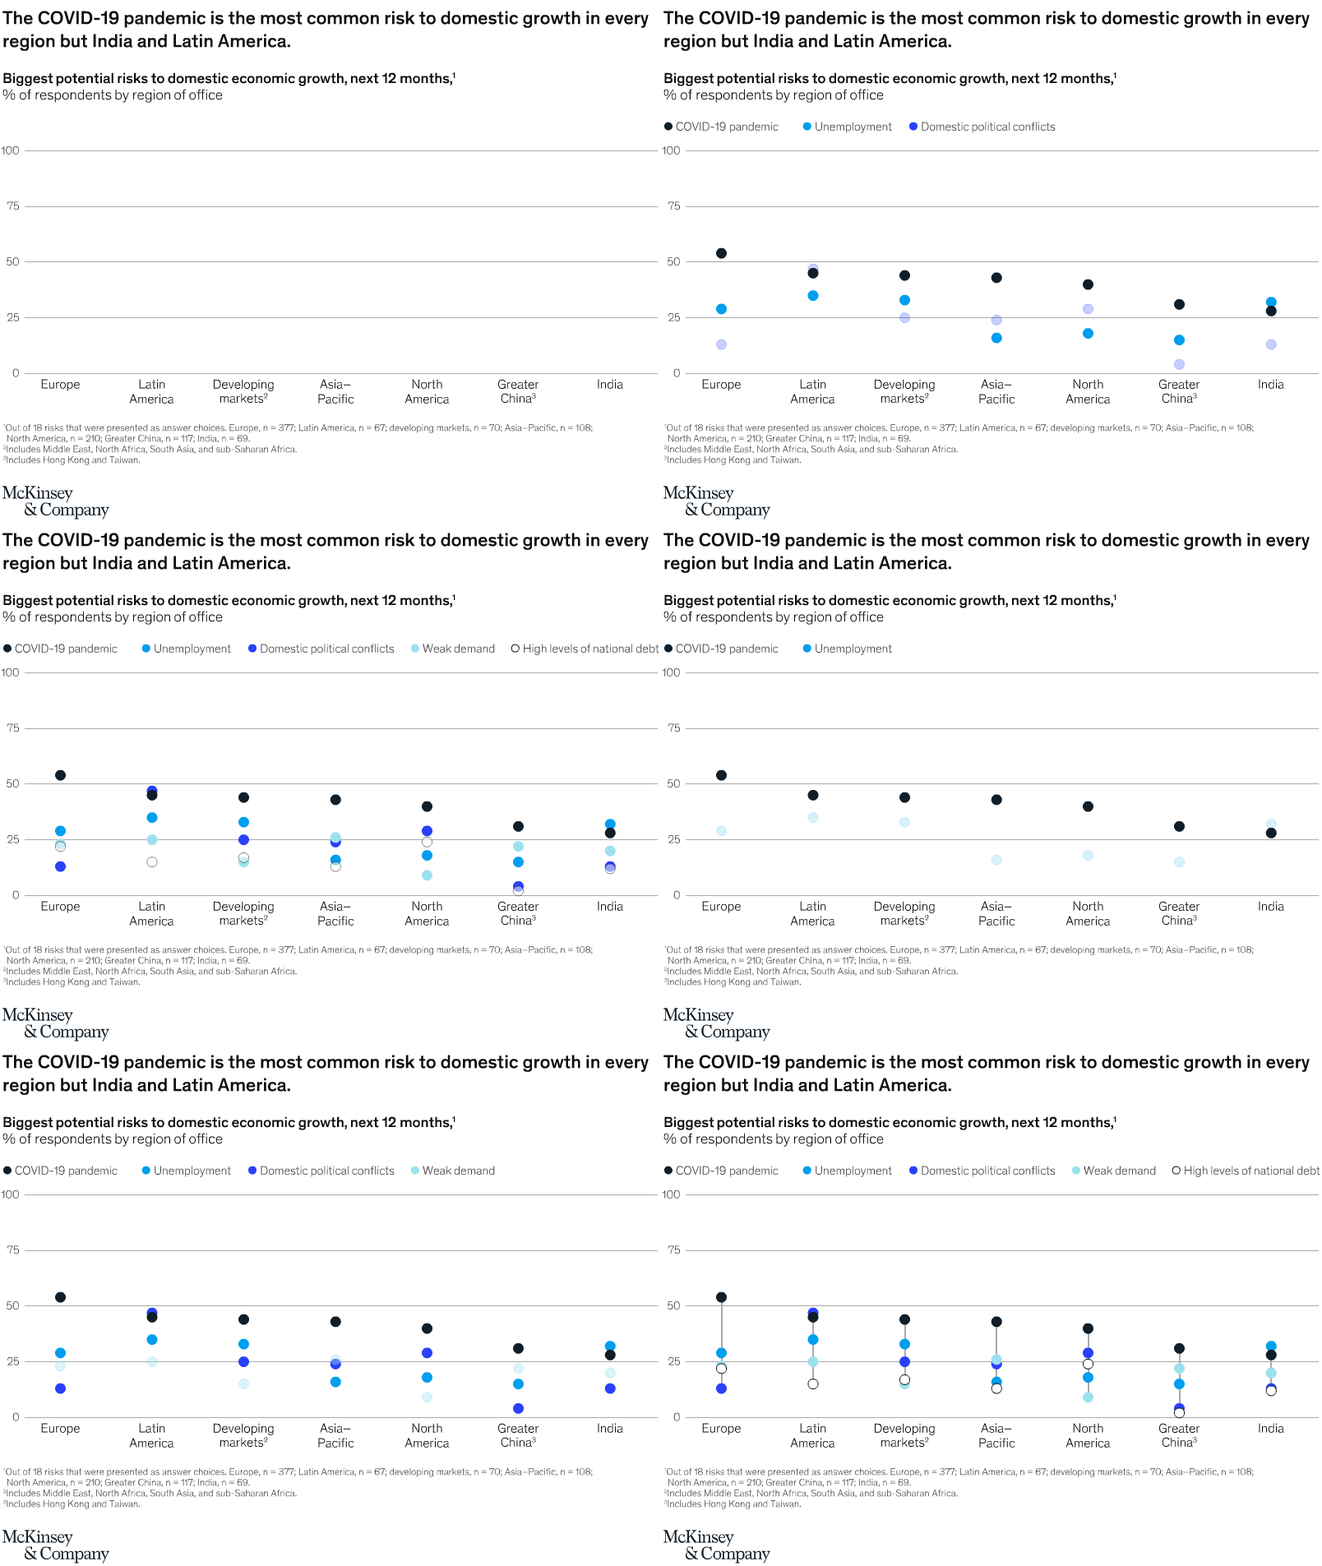
April 28, 2021 – The number-one candidate to short-circuit growth is COVID-19, and it’s not particularly close, according to the latest McKinsey Global Survey. Even in Latin America and India, where domestic conflicts and unemployment are the biggest worries, the global pandemic is a close second.
To read the survey, see “The coronavirus effect on global economic sentiment,” March 30, 2021.
customizer here
Visual form
Single-panel regional dot plot.
Layout / body structure
The chart places seven regions along the horizontal axis and stacks multiple colored risk dots vertically above each region. Reader moves left to right across Europe, Latin America, developing markets, Asia-Pacific, North America, Greater China, and India while comparing which risk sits highest in each regional cluster.
What is being compared
It compares the biggest potential risks to domestic economic growth over the next 12 months across regions of office. The risks shown are the COVID-19 pandemic, unemployment, domestic political conflicts, weak demand, and high levels of national debt.
Measurement system
The measure is percent of respondents on a 0 to 100 vertical scale. Color identifies the risk category, and the height of each dot shows how strongly respondents in that region selected that risk.
Visible structure inside the graphic
Each region repeats the same vertical stack of colored dots, making it easy to compare both the leading risk within a region and the relative position of the same risk across regions. The legend sits above the plot, and the horizontal guide lines help judge how far each dot rises above or below the 25 and 50 percent bands.
Main takeaway from the visual
The COVID-19 pandemic remains the top risk in most regions, but that pattern breaks in India and Latin America. In those two regions, other risks rise above or match the pandemic marker, which is why the visual reads as mostly one global story with two clear exceptions.
Key standout values or extremes
Europe shows the COVID-19 pandemic at just above 50 percent, the highest dot on the chart. Latin America places domestic political conflicts slightly above the pandemic in the mid-40s, while India shows unemployment above 30 and the pandemic lower, around the high 20s; Greater China has the lowest pandemic reading, near 30.
Controls / sequence, when applicable
This is a static chart image with no in-chart controls to operate.
Companion media, when applicable
There is no separate companion audio or video; the chart image is the full visual on this page.