Source page: McKinsey & Company
Commentary
Are you experienced?
Travel | Consumer
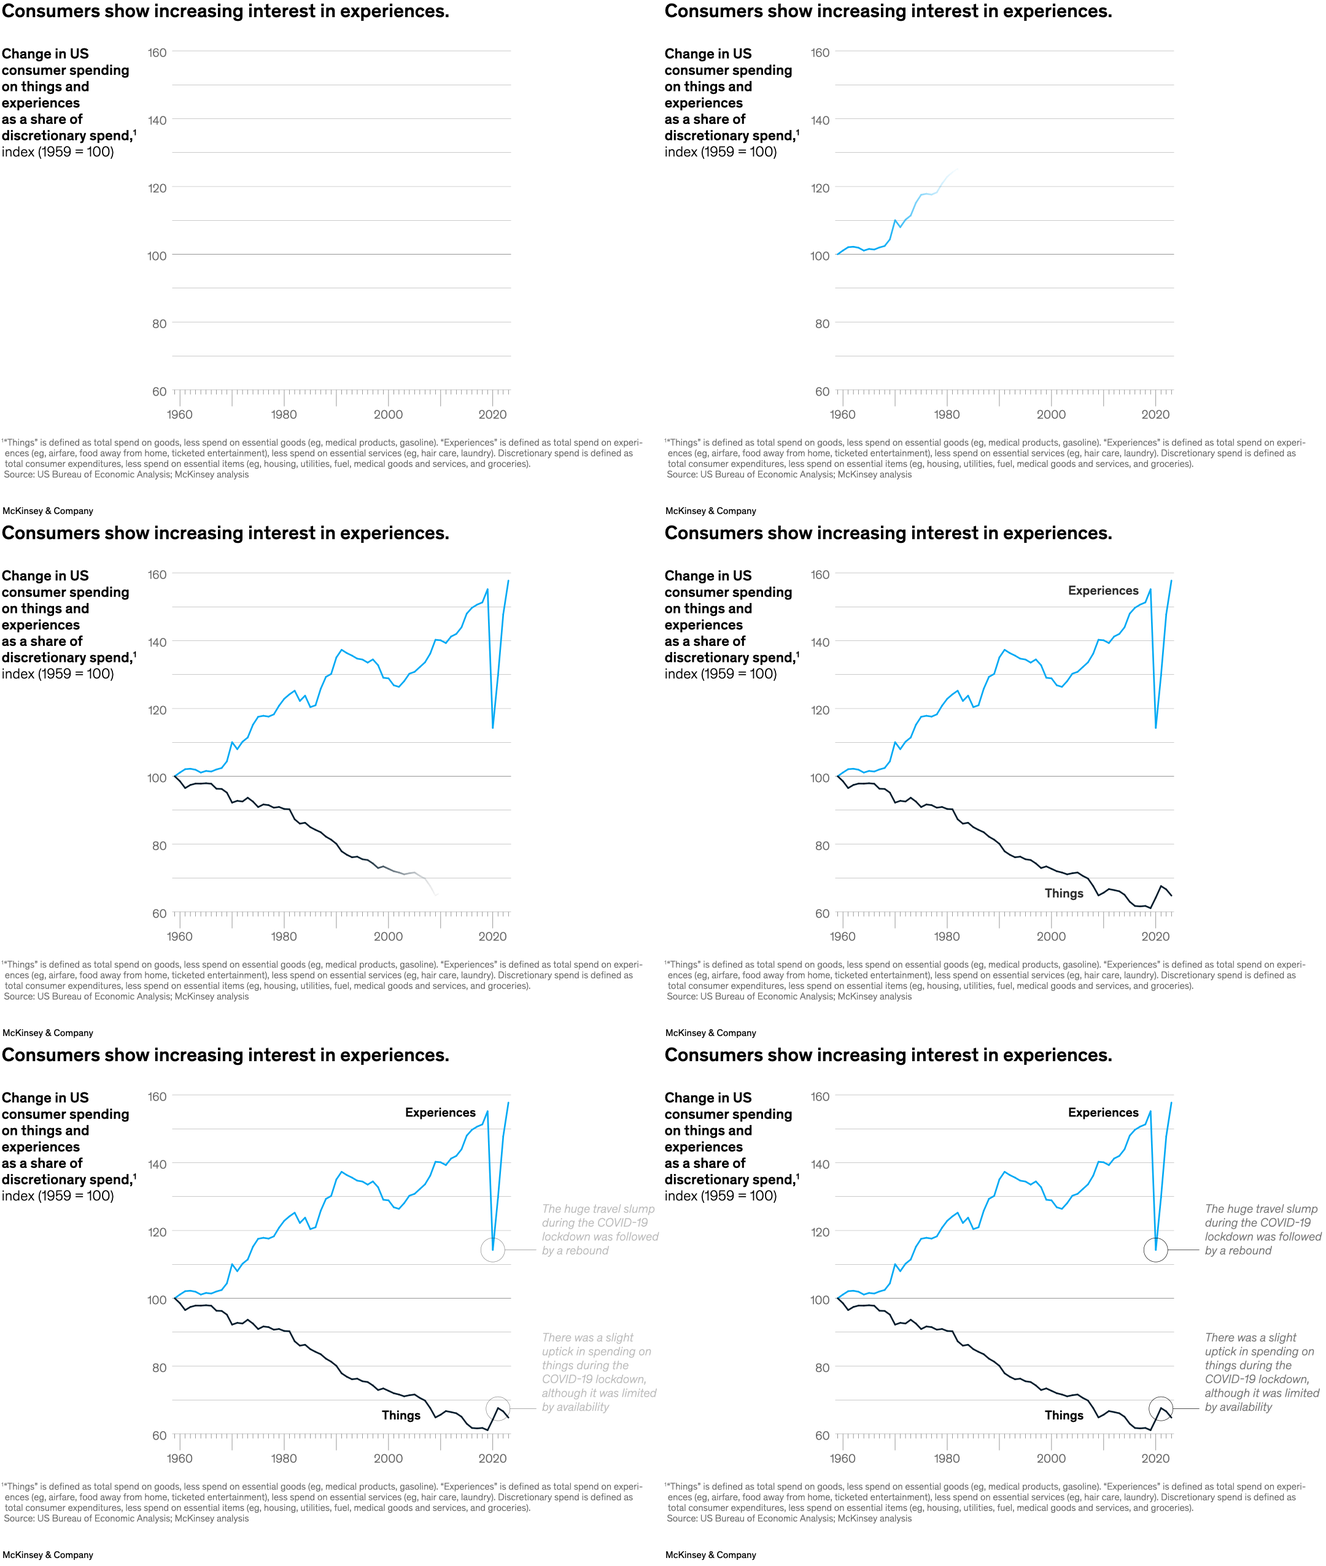
April 19, 2024 – US consumer spending on things rose slightly and spending on experiences slumped during the COVID-19 pandemic. But partner Jillian Tellez Holub and coauthors find that Americans’ outlays for recreational experiences such as stays at luxury hotels reached their highest level since 1960 after the lockdown ended. The brief uptick in spending on nonessential goods was followed by continued weakness.
To read the article, see “How the world’s best hotels deliver exceptional customer experience,” March 18, 2024.
customizer here
Visual form
Line chart.
Layout / body structure
This is a single two-series time chart running from 1960 to 2023. The reading order is left to right through the historical index, following the experiences line and the things line across the full period.
What is being compared
It compares consumer spending on things versus spending on experiences as shares of discretionary spending over time.
Measurement system
The y-axis is an index with 1959 set to 100, and the x-axis is calendar time from 1960 to 2023. One line tracks experiences and the other tracks things.
Visible structure inside the graphic
The two lines diverge steadily over the long run. The experiences line climbs upward through the decades, while the things line trends downward, with callouts marking the COVID-era dip and rebound as well as the slowdown in spending on goods.
Main takeaway from the visual
The chart shows a long-run shift in consumer preference toward experiences and away from things, with the pandemic interrupting but not reversing that structural pattern.
Key standout values or extremes
By the right edge of the chart the experiences index rises to around 160, while the things index sits down in the 60s. The experiences series shows a sharp pandemic dip and rebound, but it still finishes at a new high relative to goods.
Controls / sequence, when applicable
This is a static chart image with no in-chart controls to operate.
Companion media, when applicable
There is no separate companion audio or video; the chart image is the full visual on this page.