Source page: McKinsey & Company
Commentary
As COVID-19 surges, the top ten players own 20 percent of the online-education market in the US
COVID-19 | Education | North America
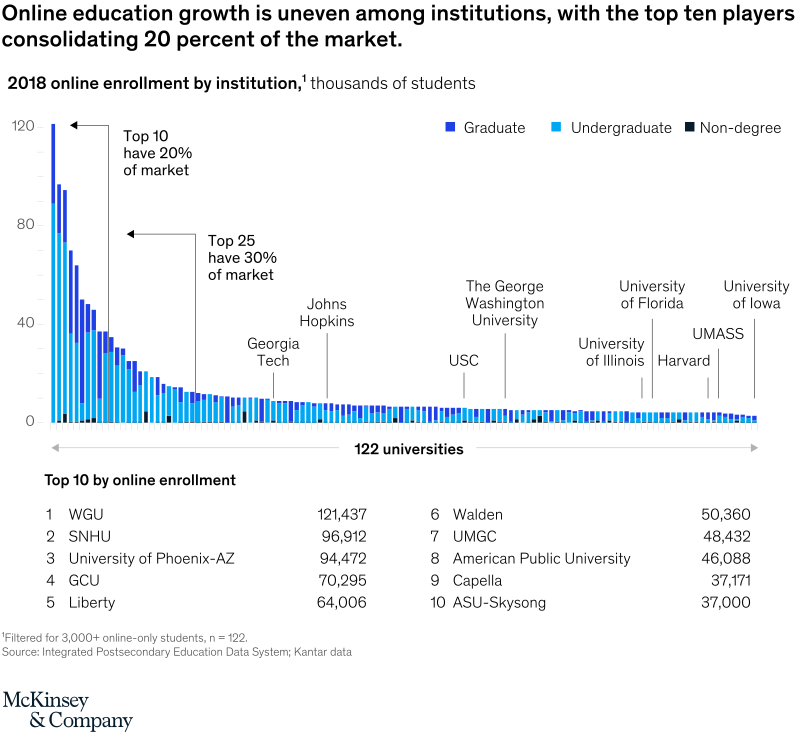
February 25, 2021 – Prepandemic, online education was already a driver of growth in higher education. COVID-19 hastened a growth spurt, and big institutions such as Western Governors University (WGU), Southern New Hampshire University (SNHU), and the University of Phoenix are building considerable market share.
To read the article, see “Scaling online education: Five lessons for colleges,” February 15, 2021.
customizer here
Visual form
Ranked stacked-bar concentration chart with a top-ten table.
Layout / body structure
The chart has one long descending sequence of institution bars across the top and a top-ten enrollment table underneath. Reader takes the tallest bars on the left first, follows the long tail across all 122 institutions, and then drops to the table for exact names and counts.
What is being compared
It compares 2018 online enrollment by institution across 122 schools and breaks each institution into Graduate, Undergraduate, and Non-degree enrollment. It also compares how much of the market is controlled by the top 10 and top 25 institutions.
Measurement system
The measure is thousands of students. Bar height shows total online enrollment, bar segments show the mix of graduate, undergraduate, and non-degree students, and the annotations summarize market share concentration at 20 percent for the top 10 and 30 percent for the top 25.
Visible structure inside the graphic
The bars descend sharply from left to right, creating a steep head and a long flat tail. Callout arrows mark the top-10 and top-25 thresholds, a few well-known universities are labeled in the middle of the tail, and the bottom table prints the exact enrollment totals for the top ten players.
Main takeaway from the visual
Online education is not spread evenly across institutions. A small group of very large providers towers over the rest of the market, and the concentration remains visible even after the chart stretches across 122 schools.
Key standout values or extremes
WGU is the largest institution at 121,437 students, followed by SNHU at 96,912, University of Phoenix-AZ at 94,472, GCU at 70,295, and Liberty at 64,006. The chart also shows Walden at 50,360, UMGC at 48,432, American Public University at 46,088, Capella at 37,171, and ASU-Skysong at 37,000, while the headline annotations say the top ten control 20 percent of the market and the top 25 control 30 percent.
Controls / sequence, when applicable
This is a static chart image with no in-chart controls to operate.
Companion media, when applicable
There is no separate companion audio or video; the chart image is the full visual on this page.