Source page: McKinsey & Company
Commentary
As winter approaches, demand for COVID-19 testing could triple
COVID-19 | Public Health
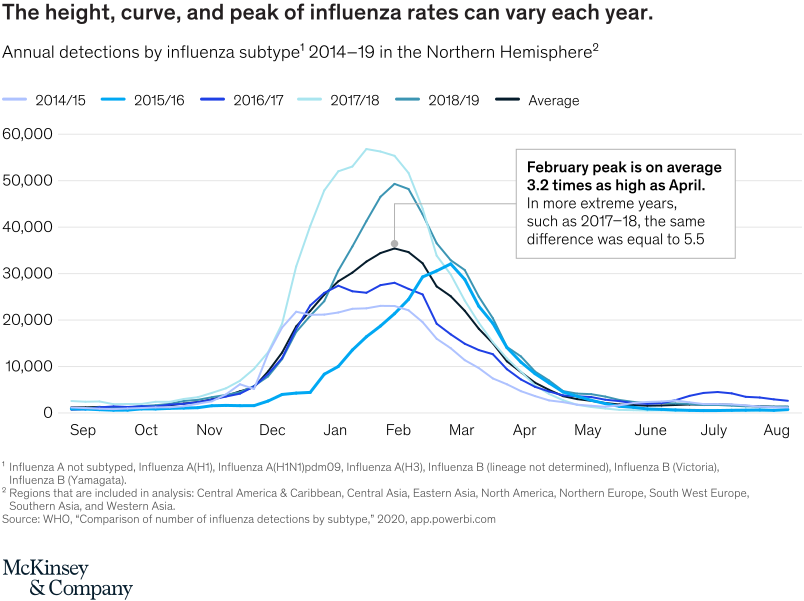
October 5, 2020 – Flu-like symptoms—which are similar to COVID-19 symptoms—are, on average, three times higher in the winter than in the spring. Demand for COVID-19 testing could, therefore, show a threefold increase during the winter months as compared with earlier months.
To read the article, see “Winter is coming: What’s next in COVID-19 testing,” September 30, 2020.
customizer here
Visual form
Seasonal multi-curve line chart.
Layout / body structure
The chart is a single seasonal time-series chart. Read it left to right across the year and compare the different influenza curves as they rise from low spring levels toward winter peaks.
What is being compared
The chart compares influenza or influenza-like-illness patterns across different years to show how winter symptom surges can multiply demand for COVID-19 testing.
Measurement system
The main measure is seasonal illness level over time. The chart emphasizes the relative winter peak versus the lower spring baseline rather than one fixed absolute count.
Visible structure inside the graphic
Several yearly flu curves share the same calendar axis, each with its own height, curve, and peak timing. The repetition of multiple winter peaks makes the seasonal testing-pressure story visible.
Main takeaway from the visual
The chart shows that winter sharply increases the pool of people with symptoms that resemble COVID-19. That seasonal surge creates a testing-demand problem even if COVID-19 case patterns themselves do not rise at the same rate.
Key standout values or extremes
The page anchors the comparison around a threefold effect: flu-like symptoms are, on average, three times higher in winter than in spring, implying that COVID-19 testing demand could triple during winter months.
Controls / sequence, when applicable
This is a static chart image with no in-chart controls to operate.
Companion media, when applicable
There is no separate companion audio or video; the chart image is the full visual on this page.