Source page: McKinsey & Company
Commentary
Attention doesn't equal revenues
Consumer | UK
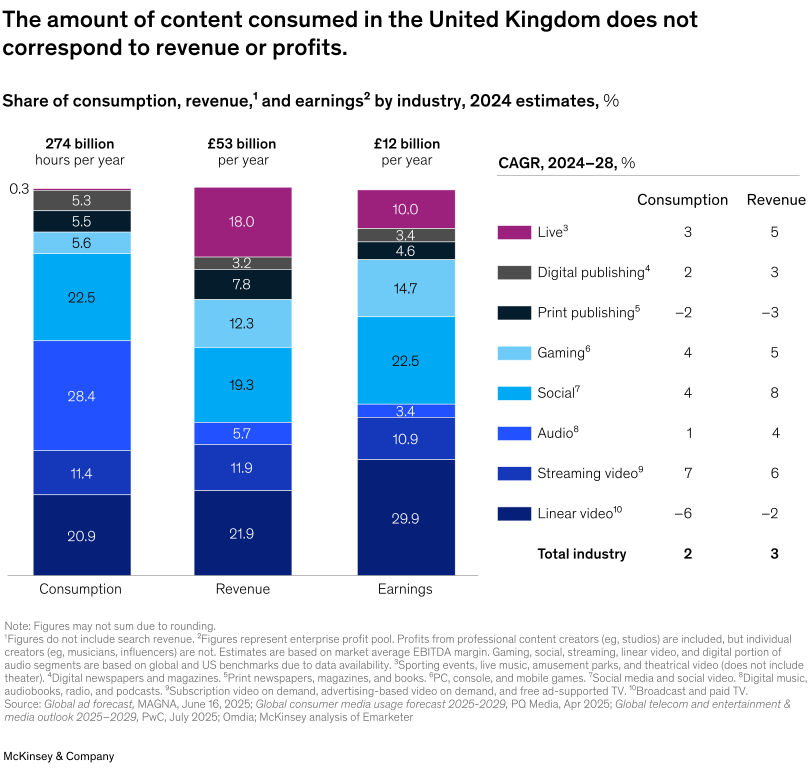
February 18, 2026 – UK media attention is largely concentrated in audio and social formats, but significant portions of the industry’s revenue and profits accrue elsewhere. Live events such as amusement parks and sporting events generate 18 percent of market revenue but account for less than 1 percent of the 274 billion hours of content consumed each year. Meanwhile, audio comprises 28 percent of consumer hours but only 6 percent of revenue. McKinsey’s Andrew Goodman, Bogdan Toma, Jamie Vickers, and coauthor explain that closing the gap requires sharper differentiation and clearer value propositions that convert attention into sustainable earnings.
To read the article, see “Mind the attention gap: Winning the battle for UK consumer attention,” December 12, 2025.
customizer here
Visual form
Stacked Bar / Stacked Column and Table (with Visual Encoding): UK media consumption, revenue, earnings, and growth-rate comparison.
Layout / body structure
Three stacked bars compare the 2024 UK media market by hours consumed, revenue, and earnings. A table beside the bars adds projected consumption and revenue CAGRs through 2028, letting the reader compare current share with expected growth.
What is being compared
It compares UK consumer-media categories across attention, money, and profit: content-consumption hours, annual revenue, annual earnings, and forecast growth.
Measurement system
Consumption is measured in billions of hours per year, revenue and earnings are measured in pounds, and the table uses compound annual growth rates.
Visible structure inside the graphic
Audio and social take large shares of consumption, while live events, video, gaming, and other categories capture more of the revenue or earnings pool. The stacked bars make the mismatch between audience time and financial return visible.
Main takeaway from the visual
The visual shows that attention does not automatically convert into revenue or profits. Some formats command many hours but relatively little money, while live and video-related categories monetize a much smaller share of consumer time.
Key standout values or extremes
Audio accounts for 28.4 percent of consumption but only 5.7 percent of revenue. Live events account for less than 1 percent of the 274 billion hours consumed but 18.0 percent of the GBP 53 billion revenue pool. Earnings total about GBP 12 billion, led by video at 29.9 percent and social at 22.5 percent.
Controls / sequence, when applicable
This is a static stacked-bar chart with a growth-rate table; there are no in-chart controls to operate.
Companion media, when applicable
There is no separate companion audio or video; the UK media attention-and-revenue chart is the full visual on this page.