Source page: McKinsey & Company
Commentary
Auto’s AI embrace
Operations | Digital
August 23, 2023 – All this week, our daily charts will focus on one of the hottest topics in business: AI. We’ll take a closer look at the technology’s implications for growth, industries, the workforce, and more.
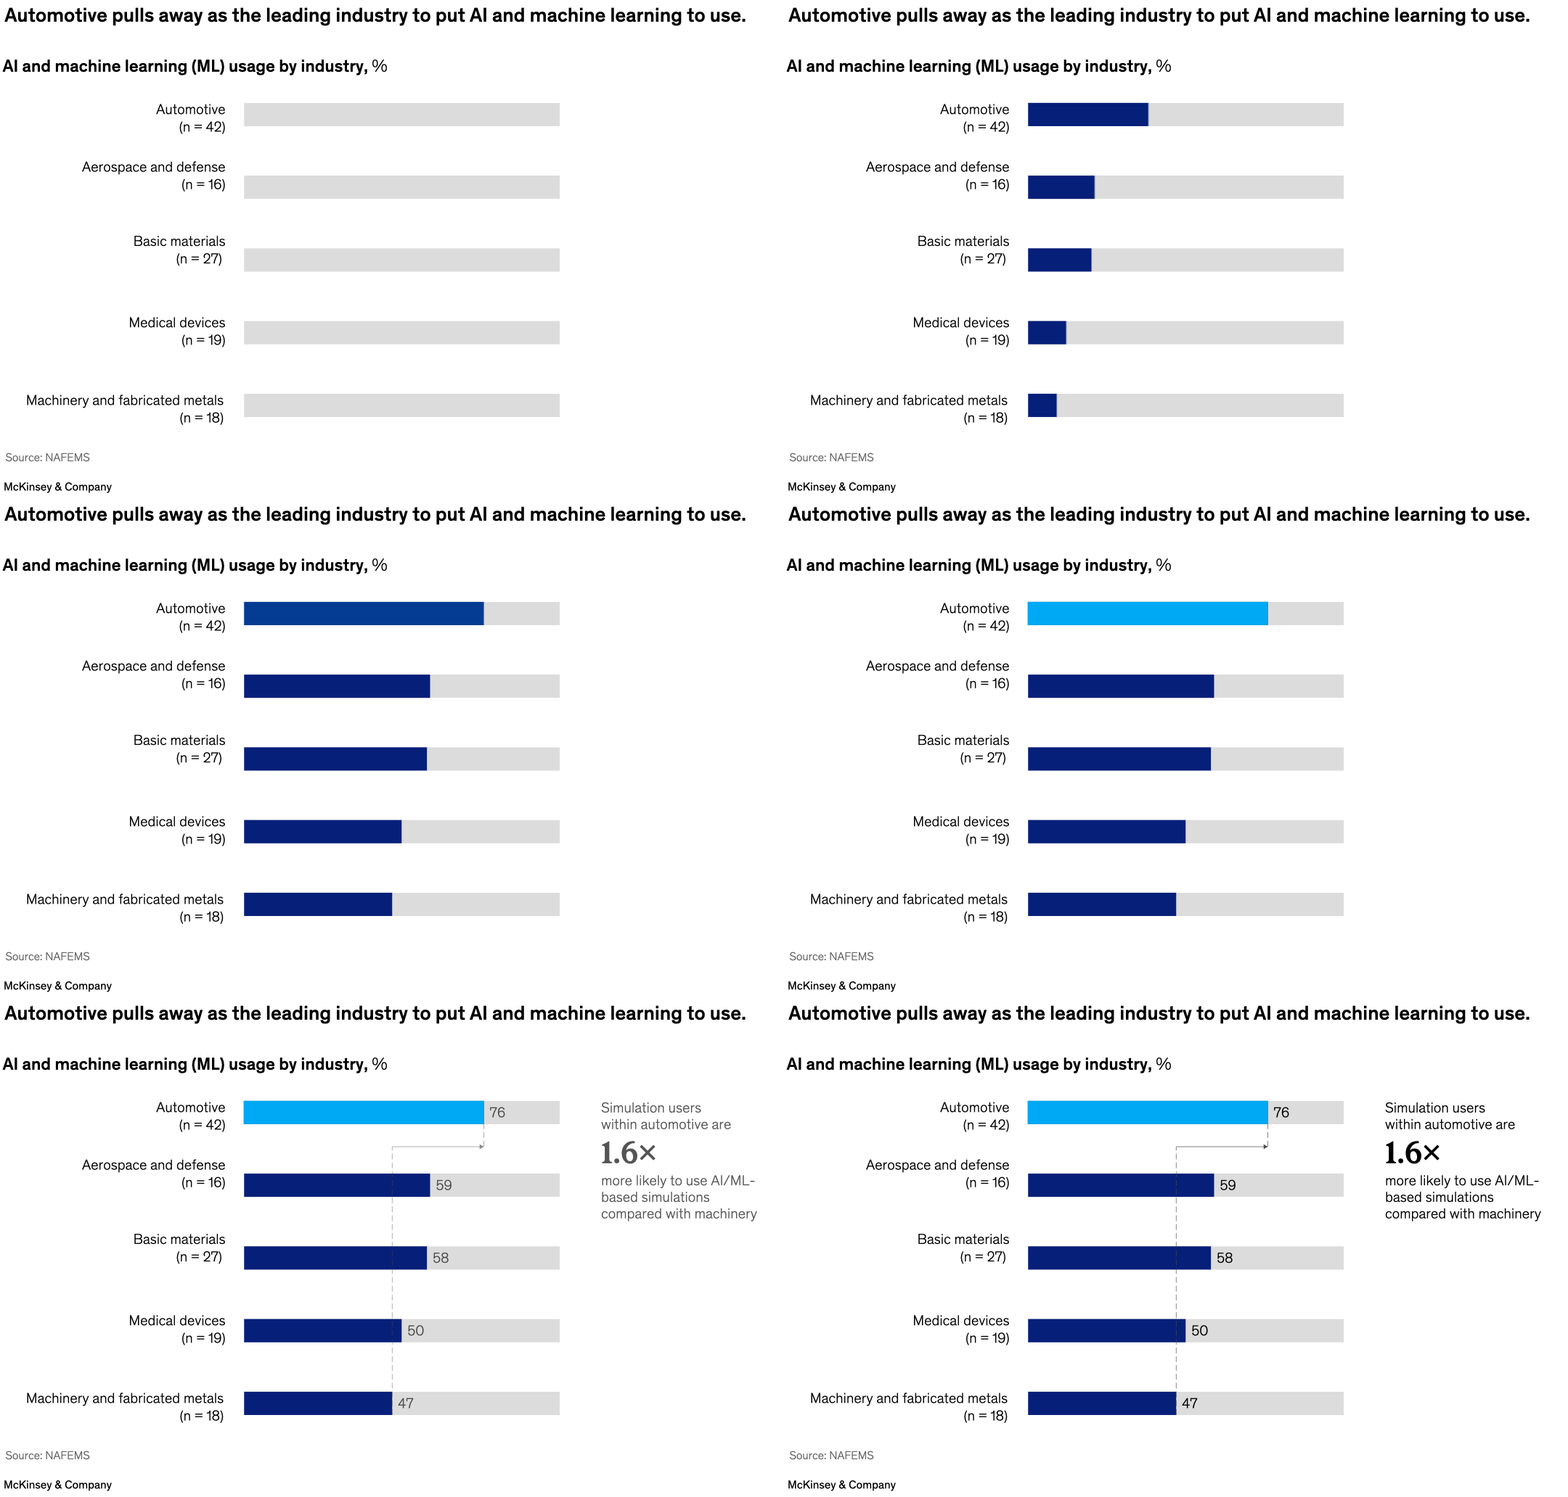
The automotive sector is one of several large industries that are poised to generate as much as one-third of sales from new products in the next few years. Getting there means turning to AI and machine-learning (ML) technologies, according to associate partner Jan Paul Stein and coauthor. The auto industry is ahead of its peers: in a survey, respondents from the automotive sector were 1.6 times as likely as those from the machinery sector to use AI/ML-based simulations.
To read the article, see “Unveiling the next frontier of engineering simulation,” June 21, 2023.
customizer here
Visual form
Horizontal bar chart.
Layout / body structure
A single ranked chart runs from top to bottom, with industry names on the left and one bar per industry extending across the page on a shared percentage scale.
What is being compared
It compares AI and machine-learning usage across industrial sectors including automotive, aerospace and defense, basic materials, medical devices, and machinery and fabricated metals.
Measurement system
The measure is percentage usage by industry, and each row label also carries a sample size in parentheses to frame how many respondents sit behind the bar.
Visible structure inside the graphic
Long horizontal bars hold the comparison, the industries are listed in a single vertical stack, and the left labels pair sector names with their respondent counts.
Main takeaway from the visual
Automotive is visibly out in front, with its bar placed above the peer industries and extending farther than the rest of the ranking.
Key standout values or extremes
The standout extreme is the top-ranked automotive row, which sits alone at the head of the chart rather than tied with another sector.
Controls / sequence, when applicable
This is a static chart image with no in-chart controls to operate.
Companion media, when applicable
There is no separate companion audio or video; the chart image is the full visual on this page.