Source page: McKinsey & Company
Commentary
B2Bs seize the right sales mix
E-commerce | Marketing & Sales
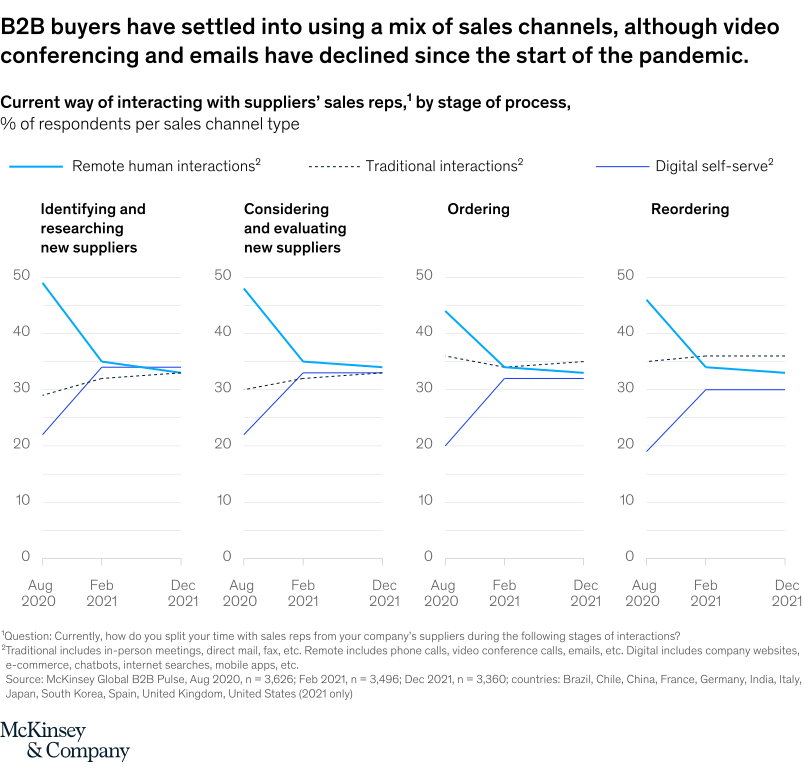
March 4, 2022 – B2B companies are hedging their bets on omnichannel sales. Although some B2Bs once jumped on pandemic-related swings from only e-commerce and then back to field sales, more buyers are aiming for balance. A recent McKinsey global survey of thousands of B2B decision makers found that they now want a mix of in-person interactions, remote contact via phone or video, and e-commerce self-service across the purchasing journey.
To read the article, see “The new B2B growth equation,” February 23, 2022.
customizer here
Visual form
Four-panel stacked time-share area chart.
Layout / body structure
The chart is split into four adjacent process-stage panels: identifying and researching new suppliers, considering and evaluating new suppliers, ordering, and reordering. Within each panel, the reader follows the stacked channel shares across multiple survey dates from 2020 to 2021.
What is being compared
The chart compares how B2B buyers divide their interactions with suppliers’ sales reps across traditional interactions, remote human interactions, and digital self-serve channels. It does this separately for four stages of the buying process and across four survey waves.
Measurement system
Each panel is measured as the percent of respondents per sales-channel type, and the stack in each panel sums to 100 percent. The page labels the three channel families directly, so the reader is tracking shifting channel share rather than raw counts.
Visible structure inside the graphic
Every stage panel uses the same stacked-band structure, with the three channel types layered across the timeline and date labels repeated below the axis. Because the panels share the same scale and structure, the reader can compare not only level changes through time but also how the sales mix differs by process stage.
Main takeaway from the visual
B2B buyers have settled into a blended sales-channel mix instead of reverting fully to one mode. Remote human interactions remain substantial but have eased from early-pandemic highs, while digital self-serve and traditional interactions persist across the process rather than disappearing.
Key standout values or extremes
The clearest visual pattern is that all four panels share the same 0 to 50 labeled half-scale and show a persistent three-way mix instead of a single dominant strip. The process-stage framing matters too: early-stage panels such as researching and considering still show a strong remote and digital presence, while reordering retains a prominent self-serve component.
Controls / sequence, when applicable
This is a static chart image with no in-chart controls to operate.
Companion media, when applicable
There is no separate companion audio or video; the chart image is the full visual on this page.