Source page: McKinsey & Company
Commentary
Batteries for the grid: A box of sunshine
North America | Decarbonization | COP-26
November 5, 2021 – Solar (and wind) power is essential for a decarbonizing power sector. But it is intermittent. Matching power supply to demand will require more than 300 GW of grid-scale storage, including lithium-ion batteries. Fortunately, projects to build more than 200 GW of battery storage have applied to connect to US grid operators as of the end of 2020, signaling a rapidly growing market.
To read the article, see “Net zero by 2035: A pathway to rapidly decarbonize the US power system,” October 14, 2021.
customizer here
Visual form
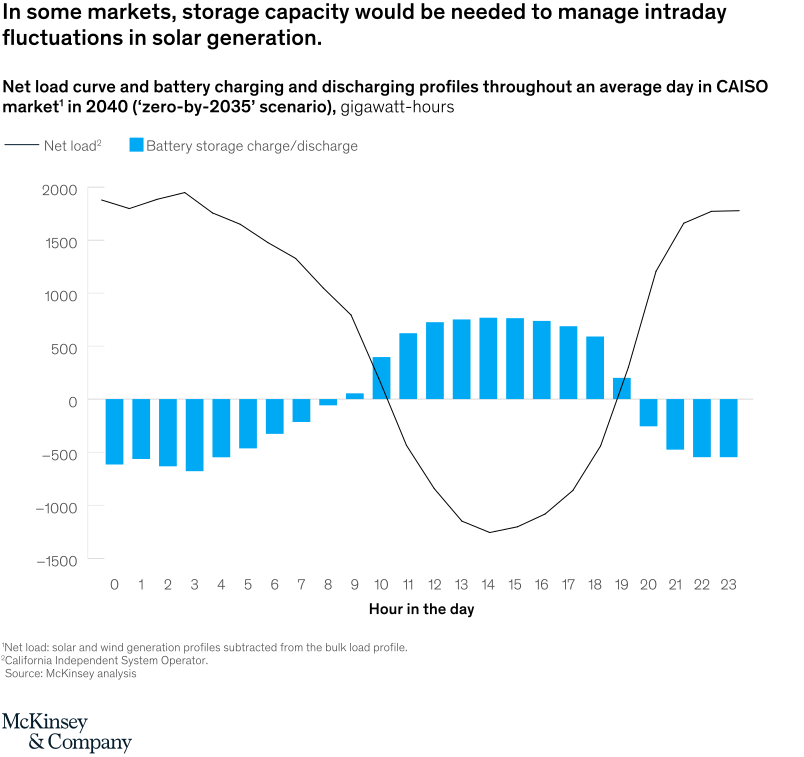
Combined line-and-bar intraday profile chart.
Layout / body structure
The chart is a single 24-hour chart with a black line for net load and blue bars for battery storage charge and discharge across each hour of the day. Reader follows the line from hour 0 to hour 23 while also watching when the blue bars drop below zero to indicate charging and rise above zero to indicate discharge.
What is being compared
The chart compares the daily net load curve in a zero-by-2035 CAISO scenario with the battery charging and discharging profile needed to manage intraday solar fluctuations. It is effectively comparing when the system has excess solar energy to absorb versus when it needs stored power returned to the grid.
Measurement system
The horizontal axis is hour in the day from 0 to 23, and the vertical axis is gigawatt-hours. The black line measures net load, while the blue bars measure battery charge or discharge, with negative bars during charging periods and positive bars during discharge periods.
Visible structure inside the graphic
The net-load line starts high overnight, falls sharply into deep negative territory around midday, then climbs back up steeply in the evening. The blue bars mirror that rhythm in the opposite operational direction, showing large negative charging volumes in the early hours and again late in the day, then a long positive discharge block from roughly late morning through early evening that peaks near the middle of the day.
Main takeaway from the visual
Storage is needed to shift solar-heavy midday surplus into the evening demand ramp. The chart makes that clear because the deepest midday trough in net load aligns with the strongest positive discharge sequence later in the day, turning battery storage into the bridge between low-load solar hours and the steep evening climb.
Key standout values or extremes
The net-load curve bottoms out around negative 1,200 to negative 1,300 gigawatt-hours near hours 13 to 14, then rises back toward roughly 1,800 by the end of the day. The discharge bars peak at around 800 gigawatt-hours in the middle of the positive block, while the charging bars reach roughly negative 600 to negative 700 in the overnight and late-evening hours.
Controls / sequence, when applicable
This is a static chart image with no in-chart controls to operate.
Companion media, when applicable
There is no separate companion audio or video; the chart image is the full visual on this page.