Source page: McKinsey & Company
Commentary
Battery boom
Mobility | Manufacturing
February 3, 2023 – Demand for electric vehicles is expected to keep soaring. As a result, the value chain for batteries could increase by as much as tenfold by 2030 and reach annual revenue as high as $410 billion. To get ahead of delays and cost overruns, senior partner Martin Linder and coauthors suggest that companies consider sourcing—particularly battery manufacturing equipment and raw materials—during construction and production operations.
To read the article, see “Power spike: How battery makers can respond to surging demand from EVs,” October 18, 2022.
customizer here
Visual form
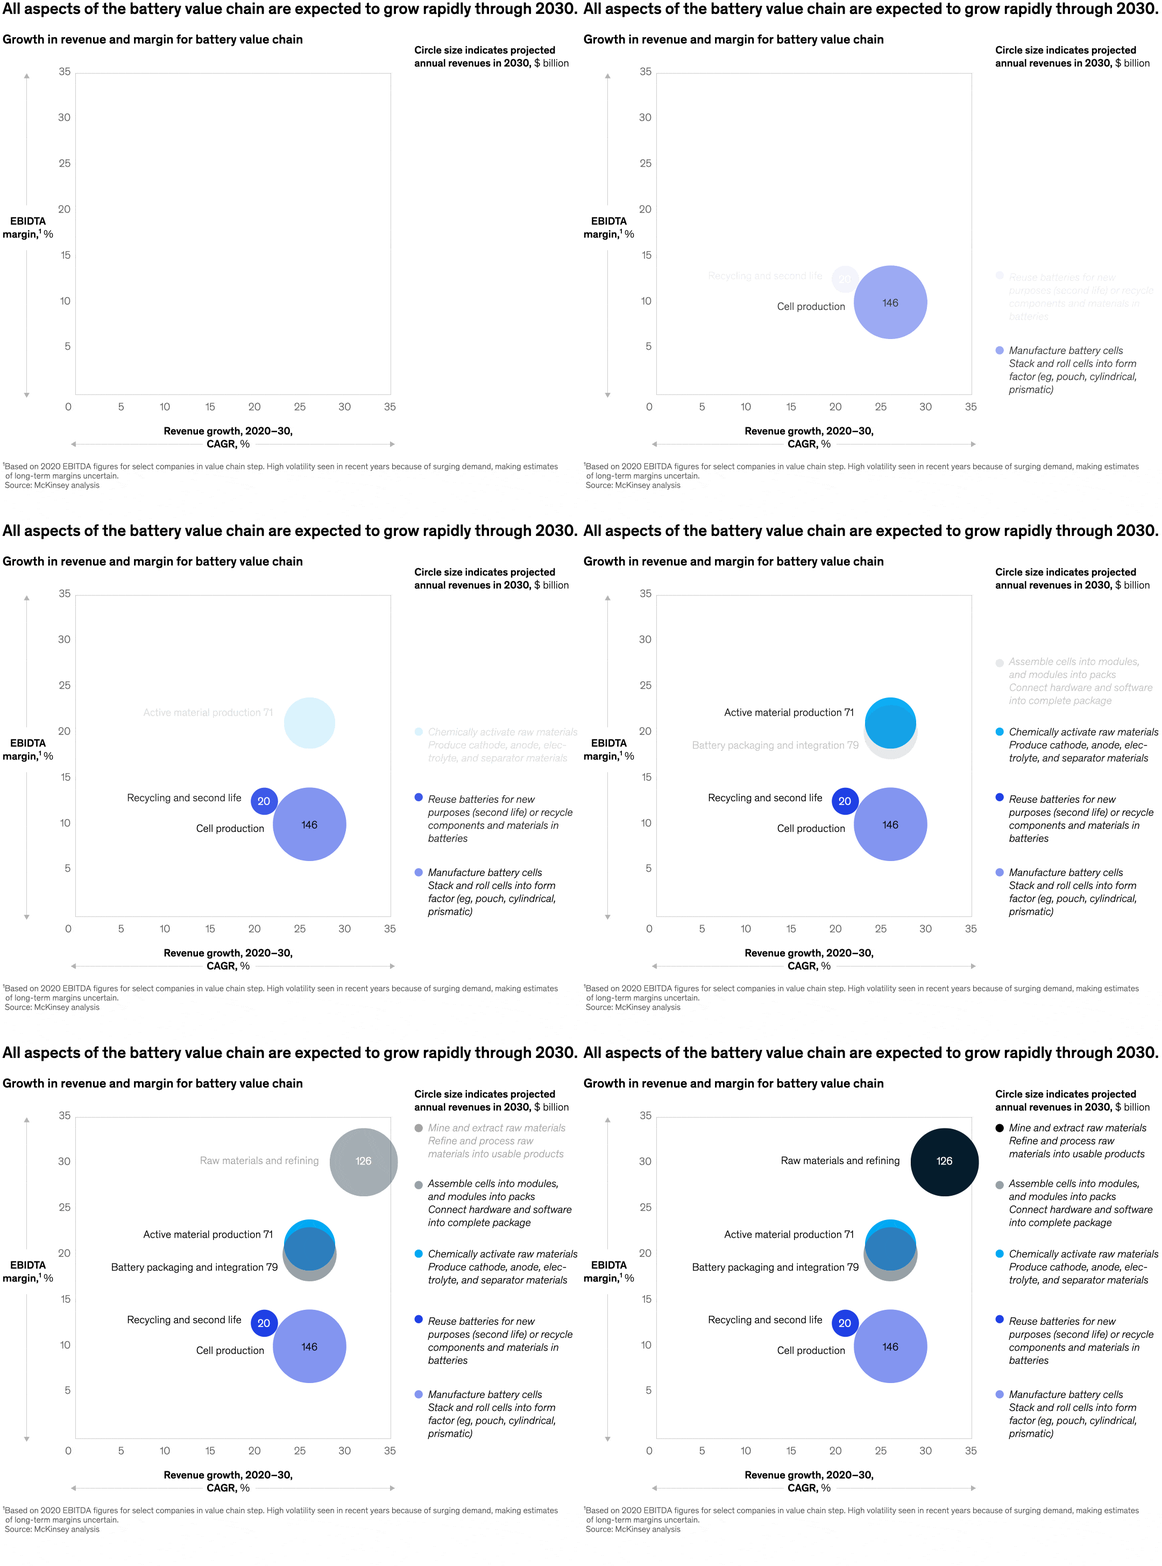
Animated multi-panel chart sequence.
Layout / body structure
The visual is laid out as a timed series that walks through the battery value chain rather than as a single static panel. Reader follows the sequence panel by panel as different parts of the chain are highlighted, with supporting notes sitting beneath the animated frames.
What is being compared
It compares the major segments of the battery value chain and shows how each part is expected to expand through 2030 as electric-vehicle demand rises.
Measurement system
The core unit is annual revenue in dollars, with the framing also using an overall growth multiple for the full chain through 2030. Category labels identify the chain segments while the charted values show their scale.
Visible structure inside the graphic
The sequence groups the value chain into distinct segment views, with each animated frame isolating one or more parts of the chain so the reader can compare how they fit into the total opportunity. The internal structure is built from segment labels, category blocks or bars, and the headline total for the market.
Main takeaway from the visual
The page is designed to show that the battery boom is not confined to one narrow bottleneck. Growth spreads across the chain, which is why the chart reads like a broad industrial build-out instead of a single-winner story.
Key standout values or extremes
The headline figure is that the battery value chain could reach as much as 410 billion dollars in annual revenue by 2030. The article framing also stresses that the chain could grow by as much as tenfold over the period.
Controls / sequence, when applicable
This is a static chart image with no in-chart controls to operate.
Companion media, when applicable
There is no separate companion audio or video; the chart image is the full visual on this page.