Source page: McKinsey & Company
Commentary
Better than business as usual
Organization | Strategy | Productivity
November 4, 2025 – This week, our charts focus on productivity—from achieving successful transformations to advanced-manufacturing projects and more.
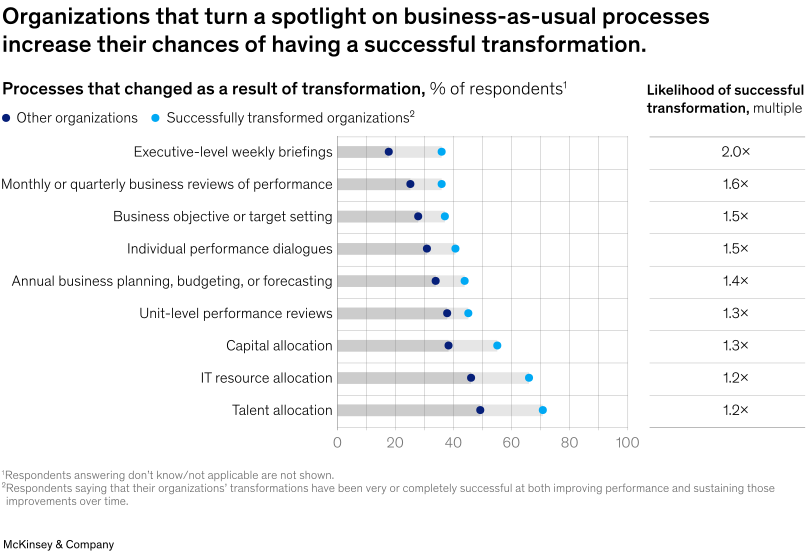
Organizations that prioritize changes to business-as-usual processes are more likely to achieve successful transformations, according to Senior Partner Dana Maor and colleagues. Companies that successfully transformed reported higher rates of change in processes such as executive-level briefings, performance reviews, and business objective setting. Organizations that changed executive-level weekly briefings were twice as likely to have a successful transformation.
To read the article, see “Want to break the productivity ceiling? Rethink the way work gets done,” August 27, 2025.
customizer here
Visual form
Scatter Plot and Table (with Visual Encoding): paired-dot process-change comparison with a success-multiple column.
Layout / body structure
Rows list business-as-usual processes. The main panel places two dots on a percent scale for each row, and the right column aligns a likelihood-of-success multiple with the same process.
What is being compared
It compares the share of respondents reporting process changes at successfully transformed organizations versus other organizations, then connects each process row to the transformation-success multiple.
Measurement system
The dot positions are percent of respondents. The right-side values are multiples of transformation success, with row alignment tying each multiple back to the corresponding process.
Visible structure inside the graphic
Each process row uses a horizontal guide line with one dot for other organizations and one dot for successfully transformed organizations. The repeated gap between the two dots shows where successful transformers changed operating routines more often.
Main takeaway from the visual
The chart shows that successful transformations are associated with changing the ordinary management routines that run the company, not just launching separate transformation initiatives.
Key standout values or extremes
Executive-level weekly briefings show the strongest success multiple at 2.0x and one of the widest dot gaps. Monthly or quarterly business reviews show 1.6x, while several planning, review, and resource-allocation processes remain in the 1.2x to 1.5x range.
Controls / sequence, when applicable
This is a fixed paired-dot chart with an aligned value column; there are no in-chart controls to operate.
Companion media, when applicable
There is no separate companion audio or video; the business-process paired-dot chart is the visual on this page.