Source page: McKinsey & Company
Commentary
Big deal? Focus on revenue growth
M&A | Strategy
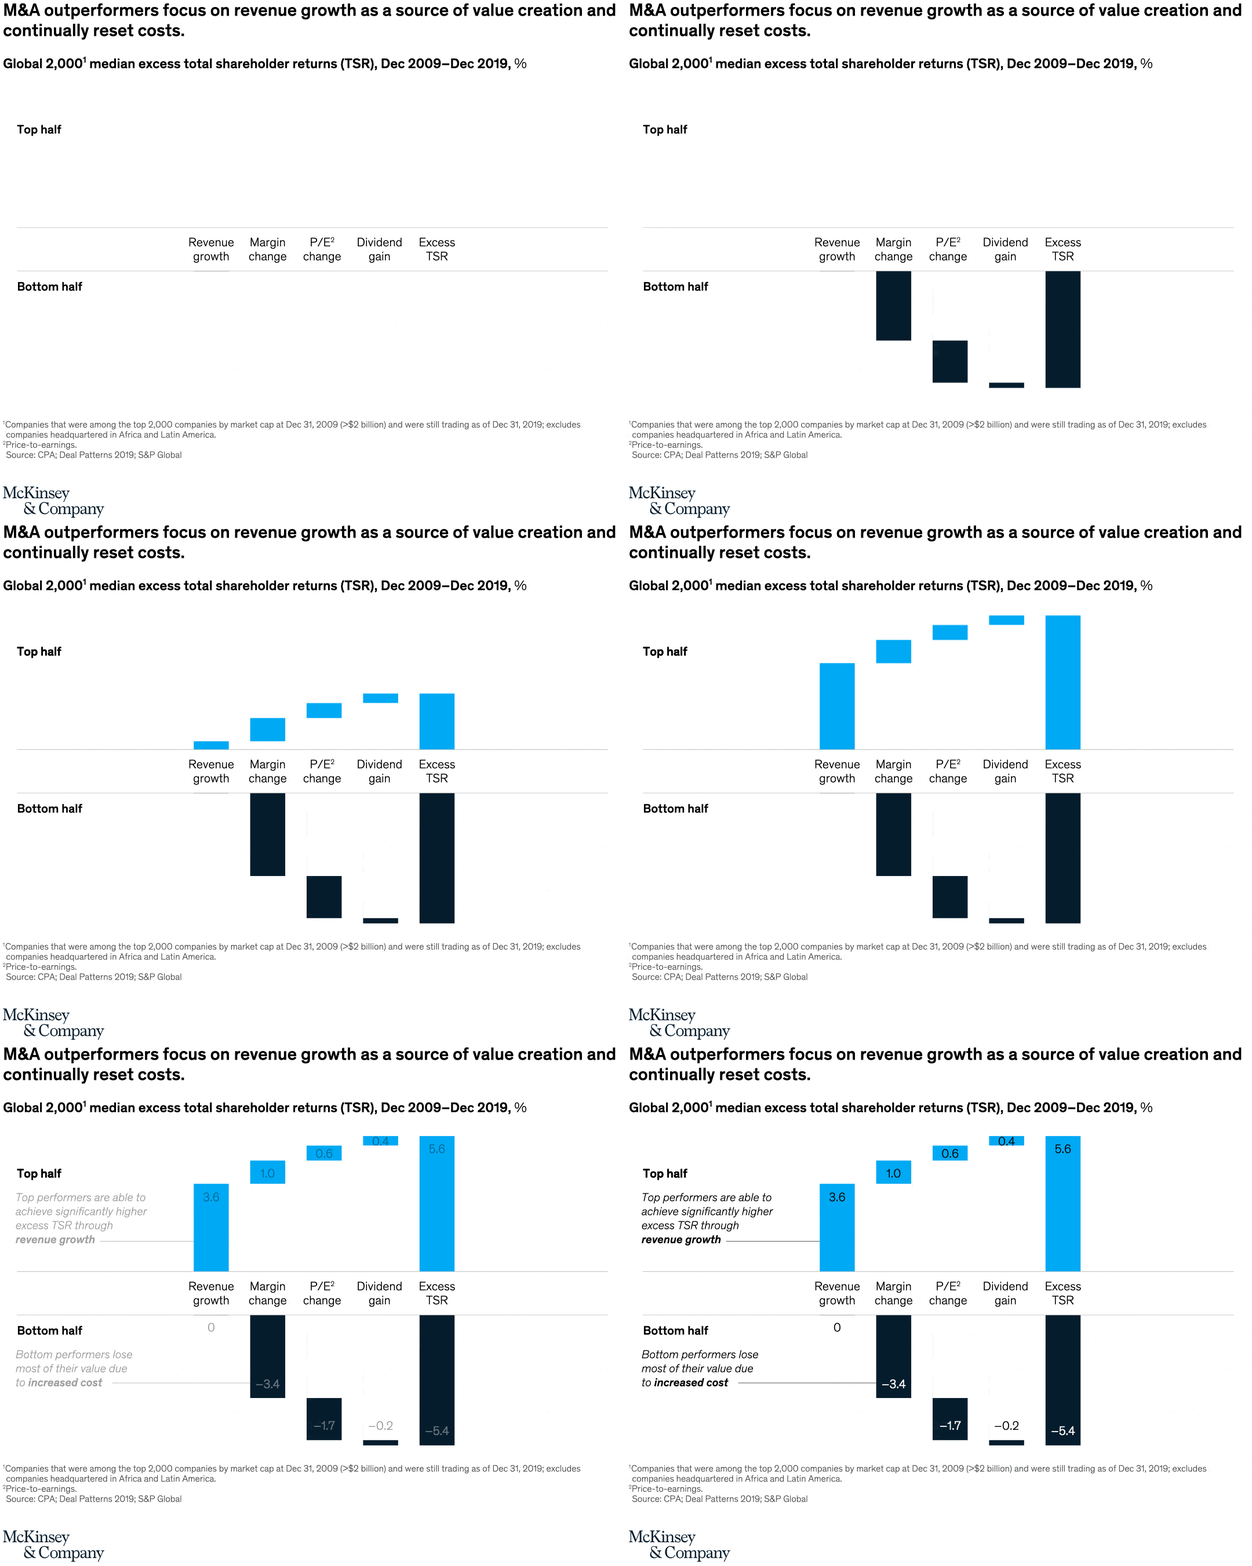
April 14, 2022 – Companies pursuing large M&A deals can increase their chances of success by considering one of a few actions, such as focusing on revenue growth. The top-half performers in our research, for example, used large deals to grow revenues but also saw improved margins and dividend changes. The bottom-half companies saw no sales growth, despite their large acquisitions, and saw their margins deteriorate.
To read the article, see “The flip side of large M&A deals,” March 25, 2022.
customizer here
Visual form
Contribution bridge chart with top-versus-bottom performer comparison.
Layout / body structure
The chart is divided horizontally into a top-half performer strip and a bottom-half performer strip, both centered on the same set of value drivers. Read the top sequence from revenue growth through excess TSR first, then drop to the bottom strip to see how the same drivers work in reverse.
What is being compared
The chart compares the components of median excess total shareholder returns for the top half versus the bottom half of a large global company set. It breaks the comparison into revenue growth, margin change, price-to-earnings change, dividend gain, and resulting excess TSR.
Measurement system
All bars are measured in percentage points of excess total shareholder returns over the 2009 to 2019 period. Positive driver contributions rise above the baseline in blue for the top half, while negative contributions fall below the baseline in dark bars for the bottom half.
Visible structure inside the graphic
The top strip is built as a step-up sequence of positive contributions that culminates in a tall excess-TSR bar, while the bottom strip mirrors it with negative contributions that pull the total downward. The identical category order in both halves makes it easy to compare which drivers create value and which ones destroy it.
Main takeaway from the visual
Top M&A performers create most of their value through revenue growth, while bottom performers lose value largely through cost and multiple pressure. The graphic makes revenue growth visually dominant in the top half, whereas the deepest losses in the bottom half come from margin change and P/E change before the negative excess-TSR total lands at the far right.
Key standout values or extremes
For the top half, revenue growth contributes 3.6 percentage points, ahead of margin change at 1.0, P/E change at 0.6, and dividend gain at 0.4, leading to 5.6 excess TSR. For the bottom half, revenue growth contributes 0, margin change is negative 3.4, P/E change is negative 1.7, dividend gain is negative 0.2, and the final excess TSR is negative 5.4.
Controls / sequence, when applicable
This is a static chart image with no in-chart controls to operate.
Companion media, when applicable
There is no separate companion audio or video; the chart image is the full visual on this page.