Source page: McKinsey & Company
Commentary
Bilateral deals pick up momentum
Geopolitics | Global Trade
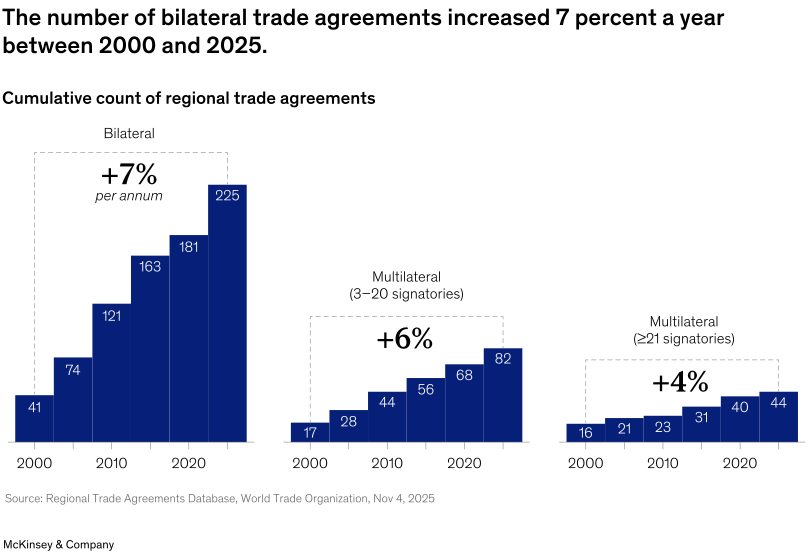
February 19, 2026 – Despite ongoing tariff and trade restrictions, global trade agreements have continued to accumulate, with one-on-one deals growing faster since 2000 than multilateral agreements. McKinsey’s Cindy Levy, Matt Watters, Sarah Zaidi, Shubham Singhal, and coauthors find that overall regional trade agreements increased fivefold from 2000 to May 2025. Bilateral trade agreements have been growing three percentage points per year faster since 2000, at 7 percent annually. As bilateral and regional trade agreements continue to evolve, businesses may find opportunities to access new markets beyond those covered by global trade regimes.
To read the article, see “Beyond the headlines: How trade agreements are reshaping business,” December 10, 2025.
customizer here
Visual form
Bar Chart: three-panel stepped cumulative-count comparison of regional trade agreements from 2000 to 2025.
Layout / body structure
The chart is split into three side-by-side panels: bilateral agreements, multilateral agreements with 3 to 20 signatories, and multilateral agreements with 21 or more signatories. Each panel uses stepped bars at five-year intervals to show cumulative growth.
What is being compared
It compares the cumulative number of trade agreements by agreement size, separating one-on-one bilateral deals from smaller and larger multilateral agreements.
Measurement system
The vertical scale is the cumulative count of regional trade agreements. The labels also show average annual growth rates from 2000 to May 2025.
Visible structure inside the graphic
All three panels rise over time, but the bilateral panel climbs fastest and ends much higher than either multilateral panel. The step pattern makes the pace of accumulation visible at 2000, 2005, 2010, 2015, 2020, and 2025.
Main takeaway from the visual
The chart shows that trade agreements have continued to accumulate despite tariff pressure and trade restrictions, with bilateral deals growing fastest.
Key standout values or extremes
Bilateral agreements rise from 41 in 2000 to 225 in 2025, a 7 percent annual increase. Multilateral agreements with 3 to 20 signatories rise from 17 to 82, while agreements with 21 or more signatories rise from 16 to 44.
Controls / sequence, when applicable
This is a static three-panel stepped bar chart; there are no in-chart controls to operate.
Companion media, when applicable
There is no separate companion audio or video; the regional trade agreement bar chart is the full visual on this page.