Source page: McKinsey & Company
Commentary
Biotech booms
Biotech | Europe
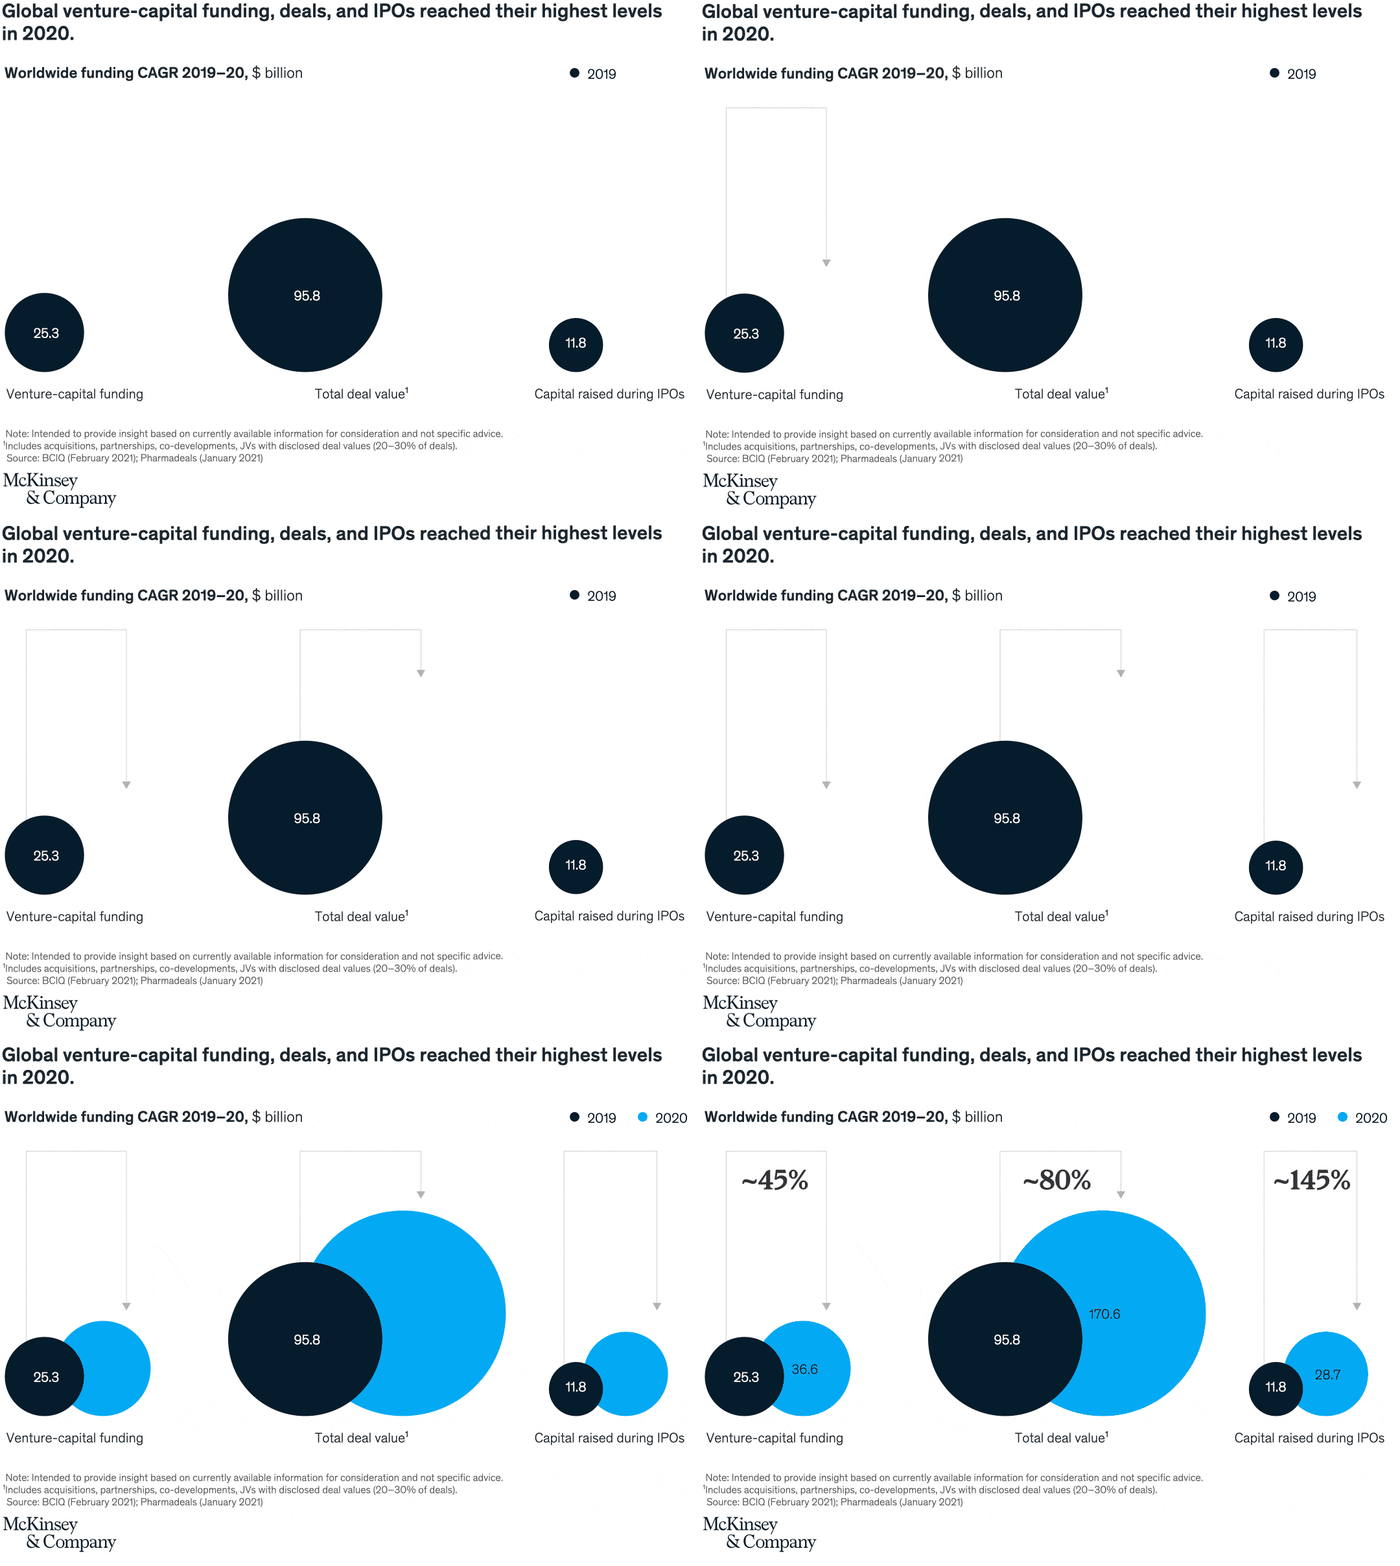
August 10, 2021 – Biotech companies continue to grow and attract major funding from both public and private sources. In 2020, global venture-capital funding and deals reached their highest ever level of $36.6 billion, while IPOs raised more than twice the amount of capital compared with 2019.
To read the article, see “Can European biotechs achieve greater scale in a fragmented landscape?” June 29, 2021.
customizer here
Visual form
Three-part proportional bubble comparison chart.
Layout / body structure
The chart is a single row of three bubble comparisons read from left to right. Each comparison pairs a dark 2019 circle with a larger blue 2020 circle and places a growth annotation above the pair.
What is being compared
The chart compares 2019 and 2020 values for three biotech financing measures: venture-capital funding, total deal value, and capital raised during IPOs.
Measurement system
Circle size and the number printed inside each bubble encode dollar amounts in billions. Dark circles denote 2019, blue circles denote 2020, and the growth labels above each pair summarize the one-year increase as an approximate percentage.
Visible structure inside the graphic
The left comparison shows venture-capital funding, the middle shows total deal value, and the right shows capital raised during IPOs. Each group contains two overlapping circles with the 2020 bubble visibly larger, plus a tall bracket-like annotation above the pair showing the approximate increase.
Main takeaway from the visual
All three biotech financing measures jump sharply in 2020, but IPO capital explodes the most. The eye is drawn to the much larger blue circles across the row, especially in the rightmost IPO panel where the relative increase is most dramatic.
Key standout values or extremes
Venture-capital funding rises from 25.3 to 36.6 billion, total deal value from 95.8 to 170.6 billion, and capital raised during IPOs from 11.8 to 28.7 billion. The top annotations summarize those jumps at roughly 45 percent, 80 percent, and 145 percent respectively, making IPOs the standout extreme.
Controls / sequence, when applicable
This is a static chart image with no in-chart controls to operate.
Companion media, when applicable
There is no separate companion audio or video; the chart image is the full visual on this page.