Source page: McKinsey & Company
Commentary
Broadening the scope of healthcare
Healthcare | Mental health
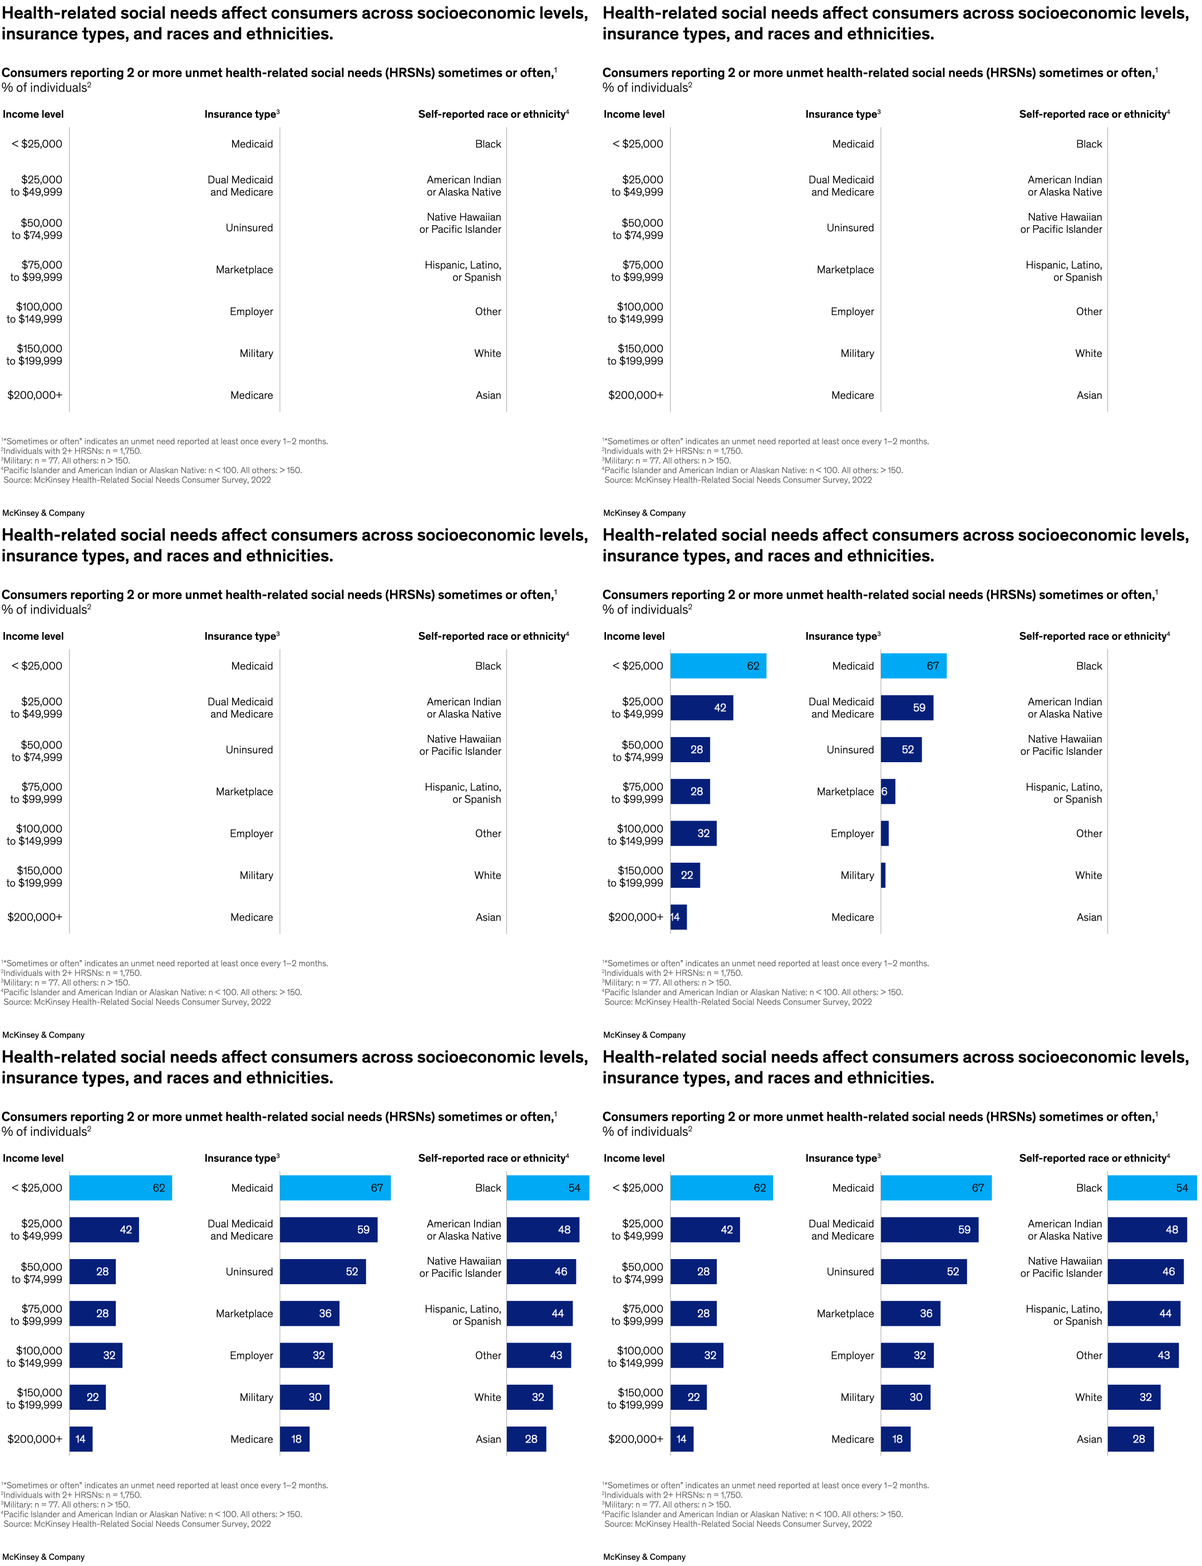
December 15, 2023 – Healthcare entities are seeking ways to address health-related social needs (HRSNs)—childcare and transportation, for example—which significantly affect health outcomes. A survey developed by senior partner Jordan VanLare and colleagues shows that unmet HRSNs are widespread but disproportionately affect certain groups. For example, while consumers with lower incomes reported a greater prevalence of unmet HRSNs, nearly one-third of consumers with incomes of $100,000 to $149,999 also reported unmet HRSNs. A review by race and ethnicity shows that some groups report being more heavily affected compared with others.
To read the article, see “Consumers’ perceptions of their health-related social needs,” November 14, 2023.
customizer here
Visual form
Three-column bar-chart display built like a compact demographic table. Each column ranks categories within one lens of the same question instead of plotting everything on one shared axis.
Layout / body structure
The chart is laid out as three vertical columns read from left to right: income level, insurance type, and self-reported race or ethnicity. Within each column the categories run from top to bottom, with a short blue bar and a printed value beside each row.
What is being compared
The visual compares the share of consumers reporting two or more unmet health-related social needs across income brackets, insurance categories, and racial or ethnic groups. It lets the reader compare differences within each demographic lens and then compare which lens shows the highest reported burden.
Measurement system
The unit is the percentage of individuals reporting two or more unmet HRSNs sometimes or often. There are no axes to read; the measurement is carried by the printed percentages and the relative bar lengths inside each demographic column.
Visible structure inside the graphic
The graphic is organized into repeated row-level bars in three separate groupings. The repeated format makes it easy to scan for the darkest or longest bars within each column and see how the pattern changes from income to insurance to race and ethnicity.
Main takeaway from the visual
Unmet social needs are not confined to one narrow consumer segment, but they are clearly concentrated in specific groups. The side-by-side columns show the highest burdens among lower-income consumers, Medicaid-linked insurance groups, and several non-White populations, while the lowest values sit at the bottom of those distributions.
Key standout values or extremes
The largest values shown are 67 percent for Medicaid, 62 percent for consumers with income below 25,000 dollars, and 54 percent for Black consumers. At the low end, the chart shows 14 percent for households at 200,000 dollars or more, 18 percent for Medicare, and 29 percent for Asian consumers.
Controls / sequence, when applicable
This is a static chart image with no in-chart controls to operate.
Companion media, when applicable
There is no separate companion audio or video; the chart image is the full visual on this page.