Source page: McKinsey & Company
Commentary
Building a business out of data
Digital | Analytics | Artificial Intelligence
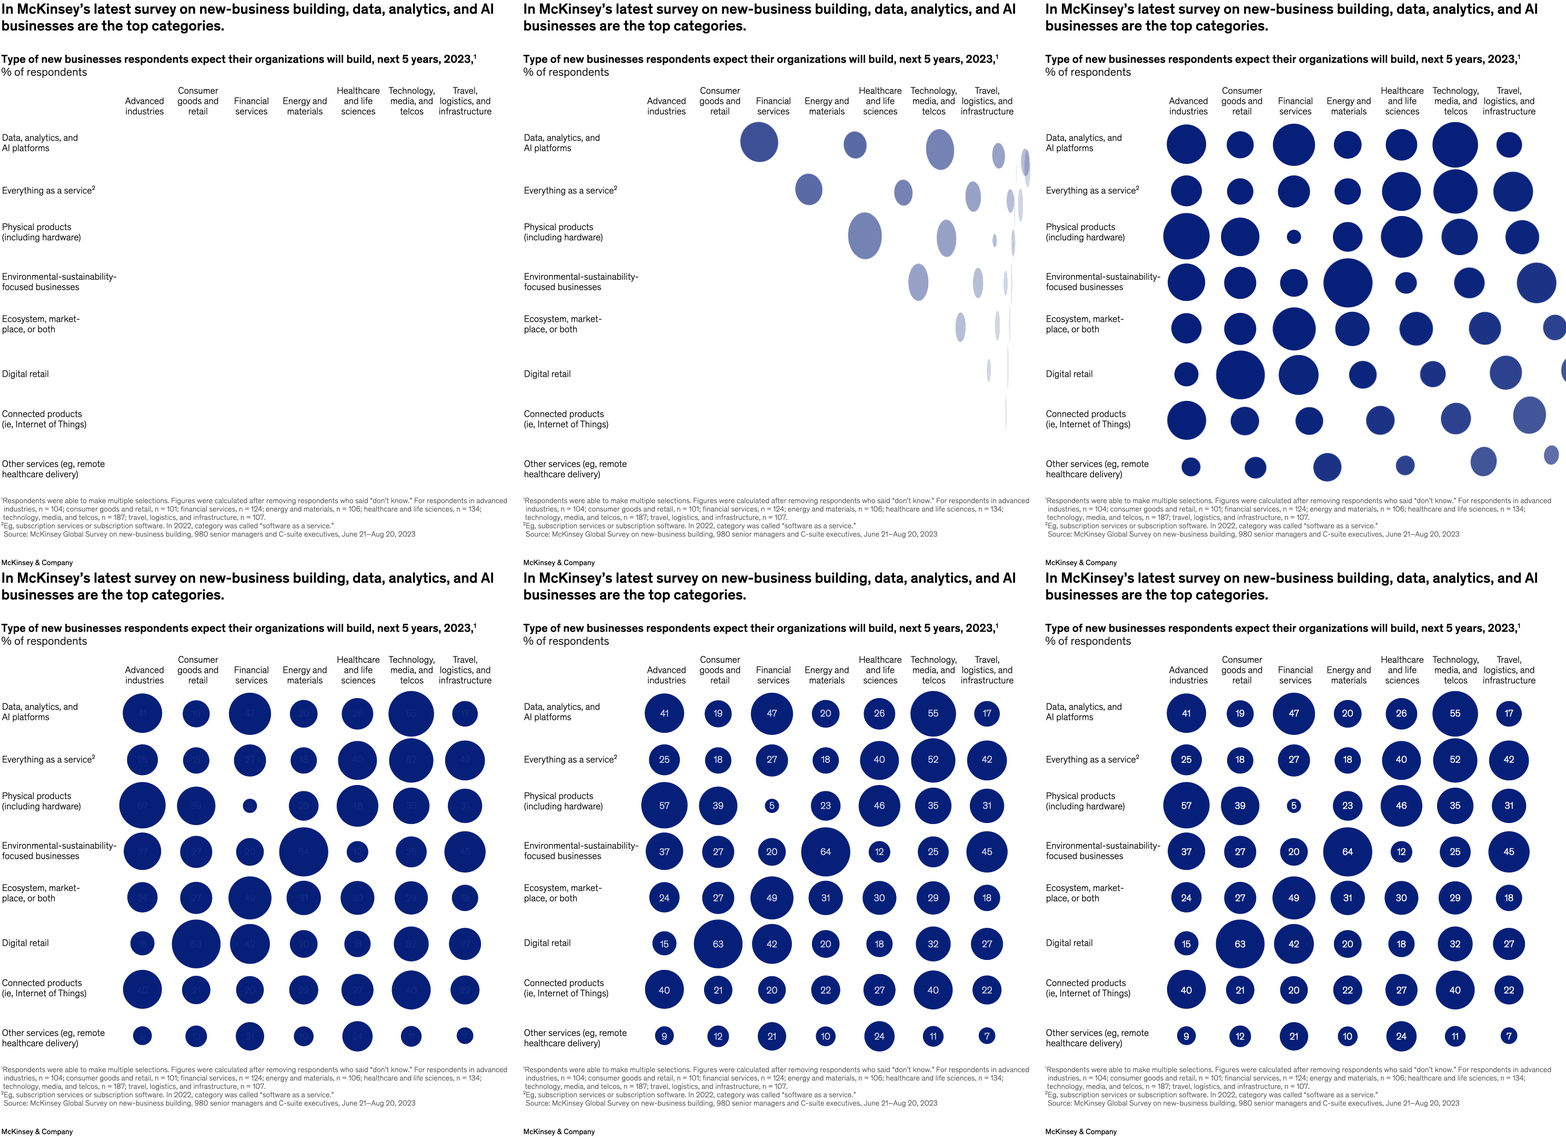
July 30, 2024 – In an era where data abundance poses both a challenge and an opportunity, companies are exploring the potential of transforming data into profitable businesses, say senior partner Ari Libarikian and coauthors. McKinsey’s survey of data business building highlights a significant trend: about 40 percent of business leaders anticipate creating data, analytics, and AI-powered enterprises within the next five years, marking it as the top category for new-business initiatives.
To read the article, see “From raw data to real profits: A primer for building a thriving data business,” July 18, 2024.
customizer here
Visual form
Bubble matrix chart.
Layout / body structure
The chart is arranged as a grid with business types listed down the left and industries across the top, so the reader scans cell by cell across the matrix and compares bubble sizes within rows and columns.
What is being compared
It compares which kinds of new businesses respondents expect their organizations to build over the next five years across seven industry groupings and eight business categories.
Measurement system
Each bubble is sized and labeled by the percent of respondents selecting that business type within that industry, and the same percentage measure is used across the whole matrix.
Visible structure inside the graphic
Each row-category and column-industry intersection contains a dark blue circle with the percentage printed inside, making the largest expectations stand out immediately while leaving blank space where categories are less favored.
Main takeaway from the visual
Data, analytics, and AI businesses show up as a top expectation in several sectors, but the chart also reveals that each industry keeps its own strongest adjacent play, such as digital retail in consumer goods and sustainability-focused businesses in energy and materials.
Key standout values or extremes
Technology, media, and telcos shows 55 percent for data, analytics, and AI platforms and 52 percent for everything as a service; financial services reaches 49 percent for ecosystem or marketplace plays and 47 percent for data, analytics, and AI; consumer goods and retail peaks at 63 percent for digital retail; energy and materials peaks at 64 percent for environmental-sustainability-focused businesses.
Controls / sequence, when applicable
This is a static chart image with no in-chart controls to operate.
Companion media, when applicable
There is no separate companion audio or video; the chart image is the full visual on this page.