Source page: McKinsey & Company
Commentary
Buyout deals bounce back
Corporate finance | Private equity | M&A
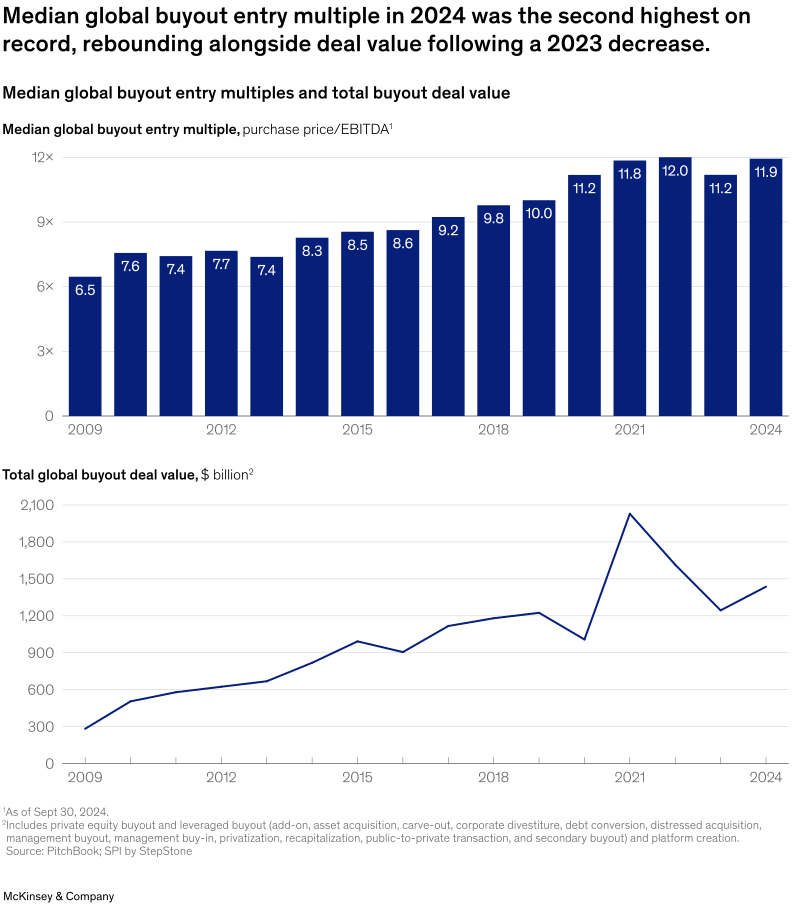
April 3, 2025 – Global buyout deal values and entry multiples experienced a significant rebound in 2024, reaching the second-highest levels on record. These increases, explain Senior Partner Alexander Edlich and coauthors, followed a decline in 2023, indicating a resurgence in the market. Given what dealmakers paid and how they financed their deals, the data potentially signal higher investor confidence. The overall increase in multiples may be attributed in part to a change in the quality mix, in which sponsors are exiting higher-quality businesses that are achieving better valuations.
To read the article, see “Global Private Markets Report 2025: Private equity emerging from the fog,” February 13, 2025.
customizer here
Visual form
Two-panel chart that combines a bar chart and a line chart.
Layout / body structure
The chart is stacked vertically, with the bar chart on top and the line chart below it. Read top to bottom: first compare the entry-multiple bars year by year, then compare the lower deal-value line over the same general time span to see how valuation levels and deal activity move together and apart.
What is being compared
It compares two related buyout measures over time: median global buyout entry multiples and total global buyout deal value. The time comparison spans the post-2009 period through 2024 so the reader can track peaks, pullbacks, and the latest rebound in both series.
Measurement system
The top panel uses purchase price to EBITDA multiples, while the bottom panel uses total deal value measured in billions of dollars. The horizontal axis is year in both panels, and the different chart types separate valuation multiples from aggregate market value.
Visible structure inside the graphic
The top panel is built from a run of annual bars, each labeled with the median entry multiple. The lower panel is a single trend line with points over time, creating a second layer that shows how deal value surged, fell, and then recovered after the 2023 dip.
Main takeaway from the visual
The graphic shows that entry valuations recovered strongly in 2024 and remained near record territory while total buyout value also bounced back after the prior-year drop. The top bars return close to the historical peak, and the lower line visibly turns upward again after falling from the 2021 high.
Key standout values or extremes
The top panel reaches 12.0 times in 2022, dips to 11.2 in 2023, and rebounds to 11.9 in 2024, making 2024 the second-highest point shown. In the lower panel, deal value peaks near 2 trillion dollars around 2021, drops sharply afterward, and then recovers to roughly 1.45 trillion dollars in 2024.
Controls / sequence, when applicable
This is a static chart image with no in-chart controls to operate.
Companion media, when applicable
There is no separate companion audio or video; the chart image is the full visual on this page.