Source page: McKinsey & Company
Commentary
Can you hear me now? Onshore oil industry needs to get better connected
Oil & Gas | 5G
November 17, 2020 – Advanced-connectivity technologies could help oil producers optimize drilling and production throughput, improve maintenance and field operations, and reduce costs. But older onshore wells—and many light tight oil fields, too—are poorly connected.
To read the article, see “How tapping connectivity in oil and gas can fuel higher performance,” November 6, 2020.
customizer here
Visual form
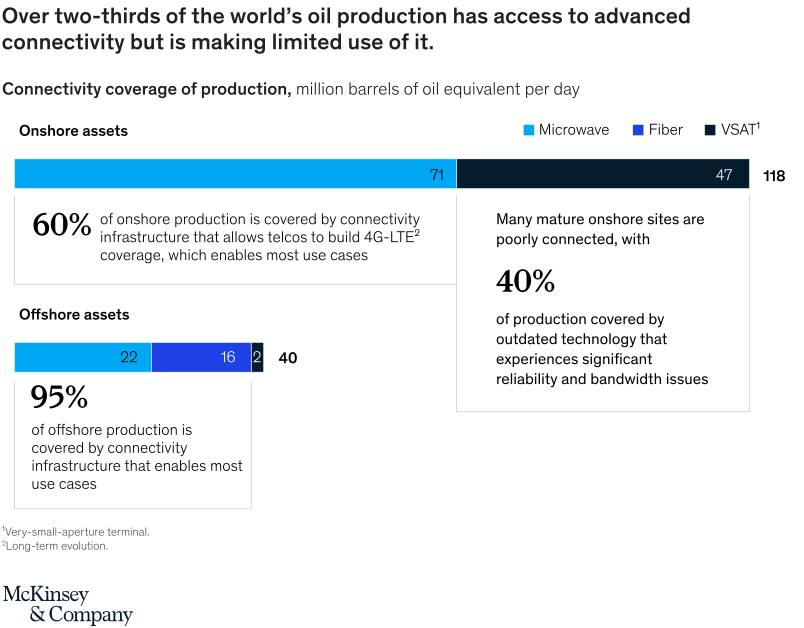
Two-category connectivity comparison chart.
Layout / body structure
The chart is a single comparison view contrasting offshore production with mature onshore production. Read the offshore side first to see the more advanced mix of connectivity types, then compare it with the onshore side where older technologies occupy much more of the picture.
What is being compared
It compares the connectivity profile of offshore oil and gas production with that of mature onshore sites. The graphic contrasts how much production is connected by fiber or microwave versus older or lower-capacity technologies such as VSAT and other outdated systems.
Measurement system
The measurement is share of production volume, expressed as percentages within each connectivity category. The chart uses category labels to show which portions of production are covered by fiber, microwave, or older technologies.
Visible structure inside the graphic
The comparison is built from two production profiles, with the offshore side dominated by fiber and microwave coverage and the onshore side showing a much larger outdated-technology segment. The split makes the infrastructure gap visible without requiring the reader to infer it from prose alone.
Main takeaway from the visual
Offshore assets already have the kind of connectivity foundation that supports modern digital operations, while many onshore assets do not. The chart makes the onshore gap look like a direct operational constraint, not just a telecom inconvenience.
Key standout values or extremes
The main anchors are that 95 percent of offshore production is connected by microwave or fiber, while many mature onshore sites remain poorly connected, with 40 percent of production covered by outdated technology. The source article also specifies the offshore split as 40 percent fiber, 56 percent microwave, and only 5 percent VSAT.
Controls / sequence, when applicable
This is a static chart image with no in-chart controls to operate.
Companion media, when applicable
There is no separate companion audio or video; the chart image is the full visual on this page.