Source page: McKinsey & Company
Commentary
Central bank liquidity injections have dropped to 15 percent of total stimulus
COVID-19 | Banking
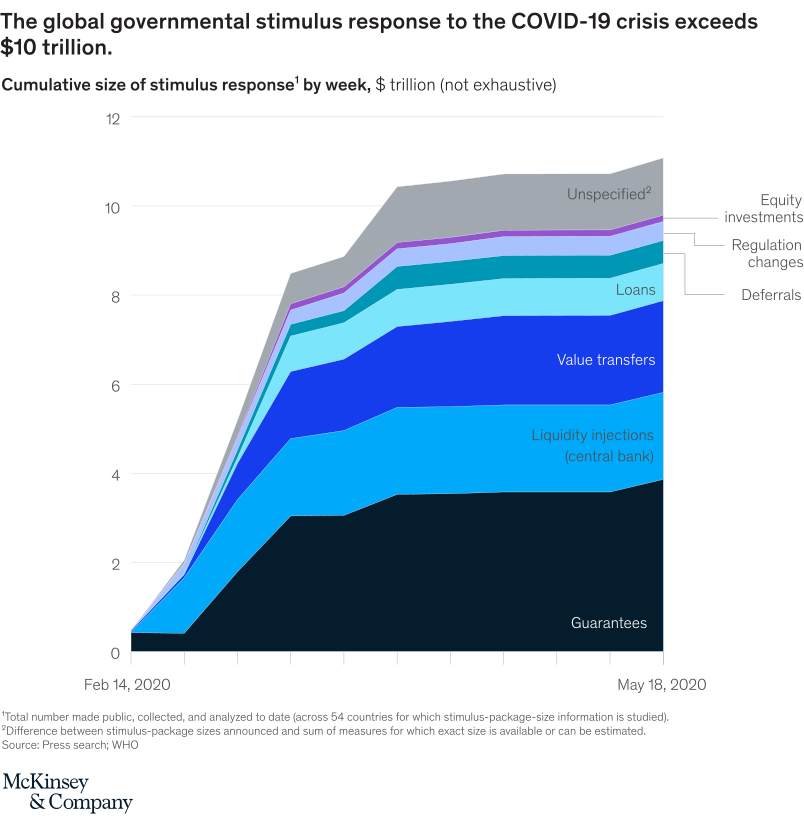
June 22, 2020 – In early March 2020, monetary-policy measures were the bulk of the first-line response to the COVID-19 crisis, representing 60 percent of the total. But not anymore since other measures—including loans, guarantees, and value transfers—have come online.
To read the article, see “The $10 trillion rescue: How governments can deliver impact,” June 5, 2020.
customizer here
Visual form
Stacked area chart of cumulative global stimulus response over time.
Layout / body structure
The cumulative total builds upward by week, with stacked layers for guarantees, central-bank liquidity injections, value transfers, loans, deferrals, regulation changes, equity investments, and unspecified measures.
What is being compared
It compares the components of global governmental stimulus during the COVID-19 crisis, showing how different policy tools contributed to the total package.
Measurement system
The vertical axis is cumulative stimulus response in trillions of dollars. The horizontal axis runs from February 14, 2020 to May 18, 2020.
Visible structure inside the graphic
The area rises very quickly in March and April and then levels around the 10 trillion dollar range. Guarantees and value transfers occupy large portions, while the central-bank liquidity layer becomes a smaller share of the total by the end.
Main takeaway from the visual
The global stimulus response exceeded 10 trillion dollars, but its composition shifted away from central-bank liquidity injections toward broader fiscal and guarantee measures.
Key standout values or extremes
The total stack reaches above 10 trillion dollars by mid-May. Liquidity injections are labeled within the stack and are no longer the dominant layer at the end of the series.
Controls / sequence, when applicable
This is a static chart image with no in-chart controls to operate.
Companion media, when applicable
There is no separate companion audio or video; the chart image is the full visual on this page.