Source page: McKinsey & Company
Commentary
Charging for charges
Automotive | Strategy
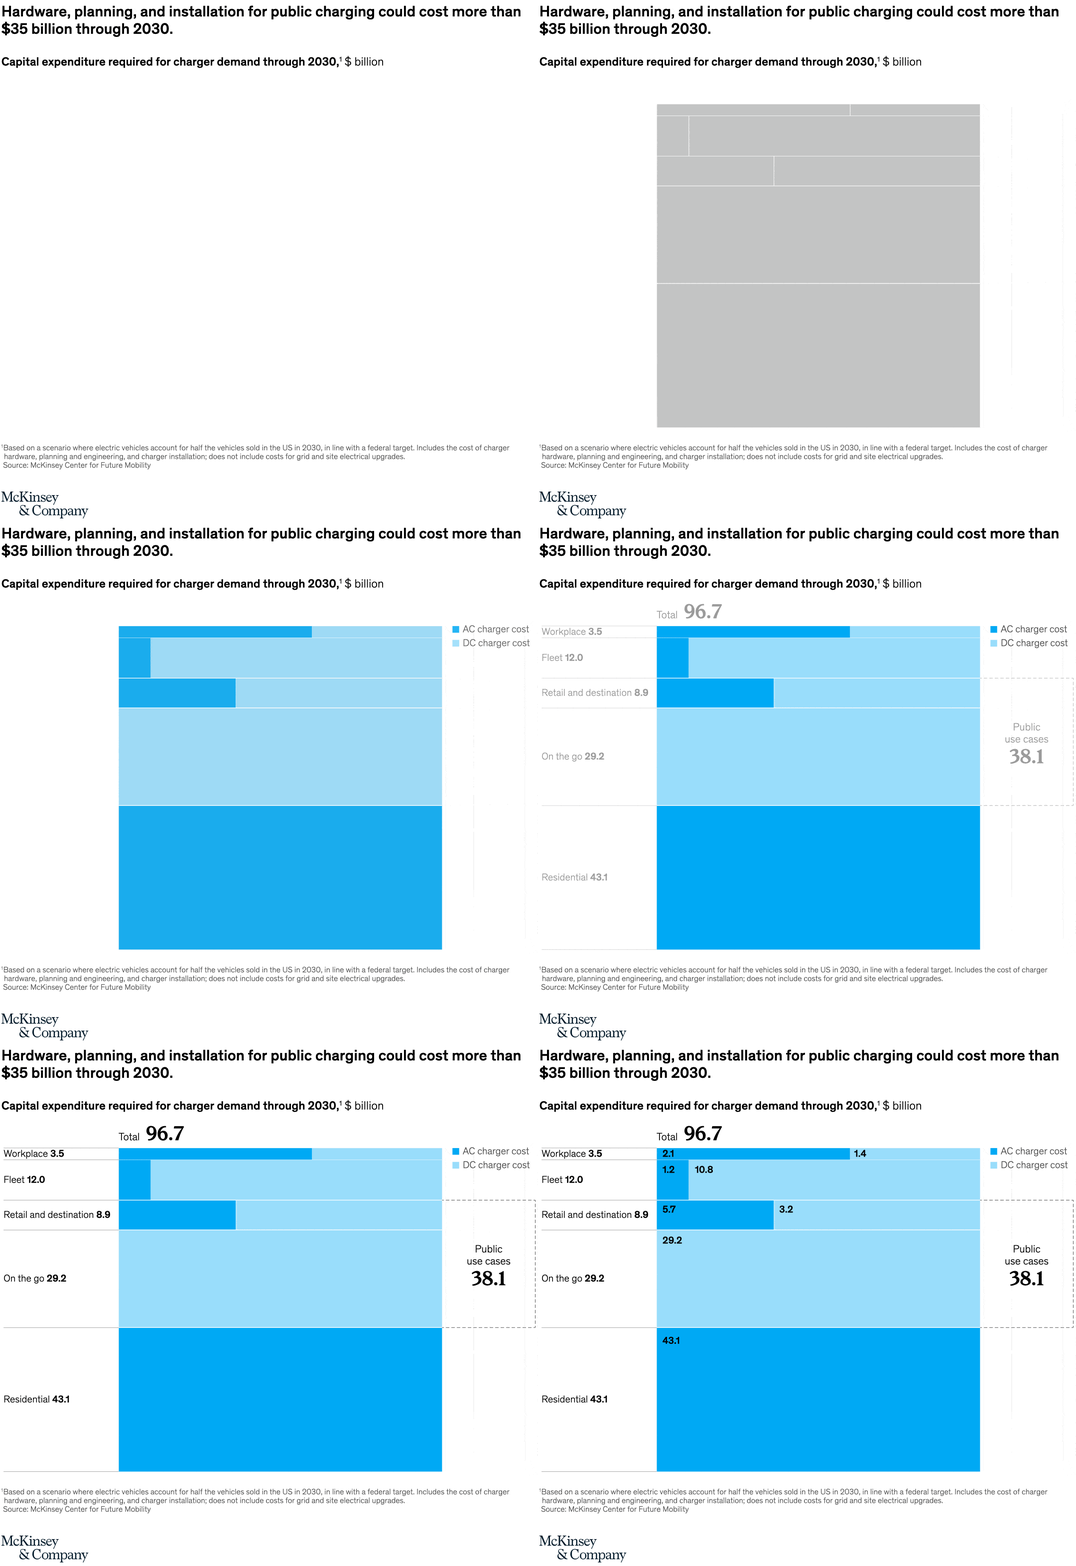
June 24, 2022 – For electric vehicles to go mainstream, the United States will need to build an extensive network of charging solutions, growing from the approximate 100,000 public chargers currently accessible to about 1.2 million by 2030. We estimate that will cost more than $38 billion, over five times more than the $7.5 billion specified for public charging stations in the recently passed Infrastructure Investment and Jobs Act.
To read the article, see “Can the automotive industry scale fast enough?,” May 12, 2022.
customizer here
Visual form
Single stacked vertical bar chart.
Layout / body structure
The chart builds one tall central bar from the bottom up, with charging-use categories listed to the left of each band and a bracket on the right labeling the public-use portion. The reading order is bottom-to-top through the stack and then across each band to see the split between AC charger cost and DC charger cost.
What is being compared
The chart compares capital expenditure required through 2030 across residential, on-the-go, retail and destination, fleet, and workplace charging. It also compares the mix of AC charger cost and DC charger cost inside those use cases and separates public use cases from the residential base.
Measurement system
All values are in billions of dollars. The total is labeled at the top of the stack, category labels carry their own dollar values, and color distinguishes AC charger cost from DC charger cost within the bar.
Visible structure inside the graphic
The base of the stack is a large residential block, above which sit the on-the-go, retail and destination, fleet, and workplace segments. The public-use bracket isolates the upper portion of the chart, and the darker inserts within several bands make the DC charger share visible against the lighter AC charger background.
Main takeaway from the visual
The visual shows that the charging build-out is a very large capital program and that the demand is not limited to public highway charging alone. Residential spending is the largest single block, while the combined public-use categories still form a substantial share of the overall stack.
Key standout values or extremes
The total at the top of the stack is 96.7 billion dollars. Residential is the largest category at 43.1, on the go is next at 29.2, retail and destination is 8.9, fleet is 12.0, workplace is 3.5, and the bracket on the right labels public use cases together at 38.1.
Controls / sequence, when applicable
This is a static chart image with no in-chart controls to operate.
Companion media, when applicable
There is no separate companion audio or video; the chart image is the full visual on this page.