Source page: McKinsey & Company
Commentary
Cheap eats
Food | Biotech
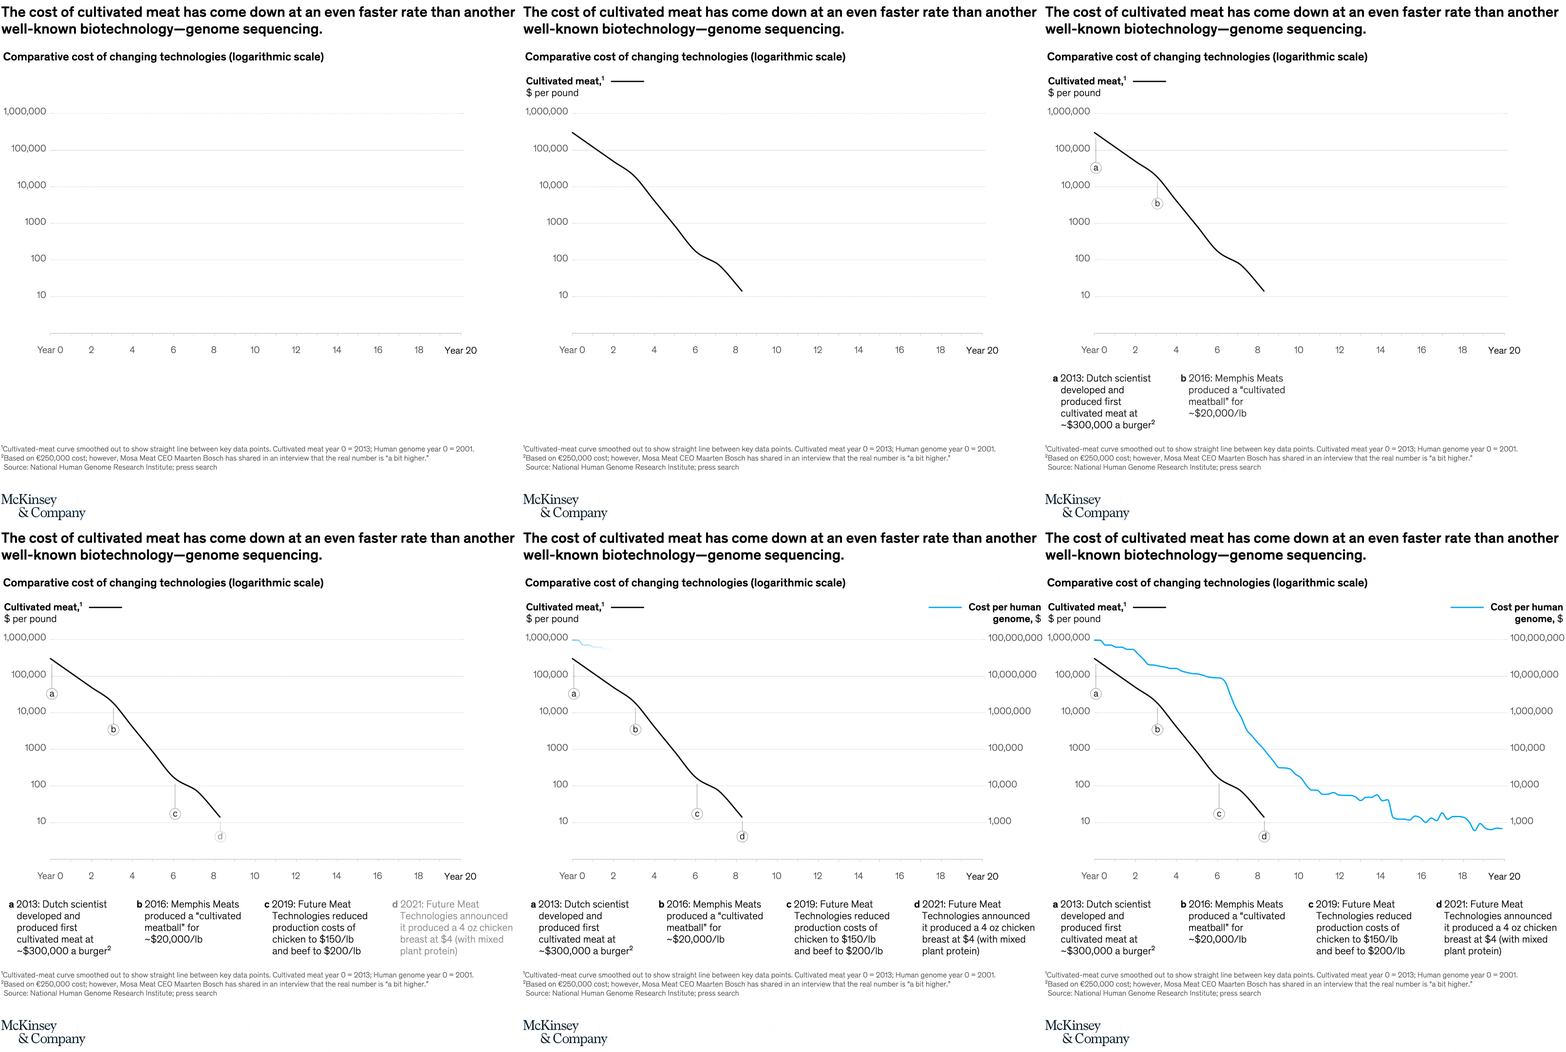
July 9, 2021 – In less than a decade, companies have been able to reduce the production costs of cultivated meat by 99 percent. If costs follow the same trajectory as that of human genome sequencing (for which costs, on average, dropped by 45 percent annually between 2001 and 2021), cultivated meat can achieve cost parity with conventional meat by 2030.
To read the article, see “Cultivated meat: Out of the lab, into the frying pan,” June 16, 2021.
customizer here
Visual form
Dual-line logarithmic cost chart.
Layout / body structure
The chart is a single chart with two cost curves plotted over a shared horizontal time axis, plus milestone callouts arranged below the plot. Reader follows the black cultivated-meat line and the blue genome line from left to right, then uses the lettered notes underneath to connect visible bends in the black curve to dated production milestones.
What is being compared
The chart compares the falling cost of cultivated meat with the falling cost per human genome over time, framing both as changing technologies on a common time progression.
Measurement system
The chart uses logarithmic cost scales with different units on each side: dollars per pound for cultivated meat on the left axis and cost per human genome in dollars on the right axis. The horizontal axis runs from Year 0 to Year 20, so the reader tracks rate of decline through the slope of each line rather than through equal linear spacing.
Visible structure inside the graphic
A black line for cultivated meat falls steeply over a shorter span and is punctuated by four lettered milestone markers, while a blue line for genome sequencing extends across the full chart and descends in a longer stair-step pattern. The footnotes and milestone captions beneath the plot anchor the black line to concrete dates and product-cost milestones.
Main takeaway from the visual
The black cultivated-meat curve drops faster and over fewer years than the genome-sequencing curve, which is why the visual argues that cultivated meat is moving down its cost curve at an unusually rapid pace. Both lines descend sharply, but the cultivated-meat path looks especially compressed and steep.
Key standout values or extremes
The milestone callouts mark cultivated meat at about $20,000 per pound in 2016, chicken at $150 per pound and beef at $200 per pound in 2019, and a 4 ounce chicken breast at $4 in 2021. The blue genome line starts near the top of the right scale in the tens of millions and falls toward the low-thousands range by the far right of the chart.
Controls / sequence, when applicable
This is a static chart image with no in-chart controls to operate.
Companion media, when applicable
There is no separate companion audio or video; the chart image is the full visual on this page.