Source page: McKinsey & Company
Commentary
Chip crunch
Semiconductors | Growth
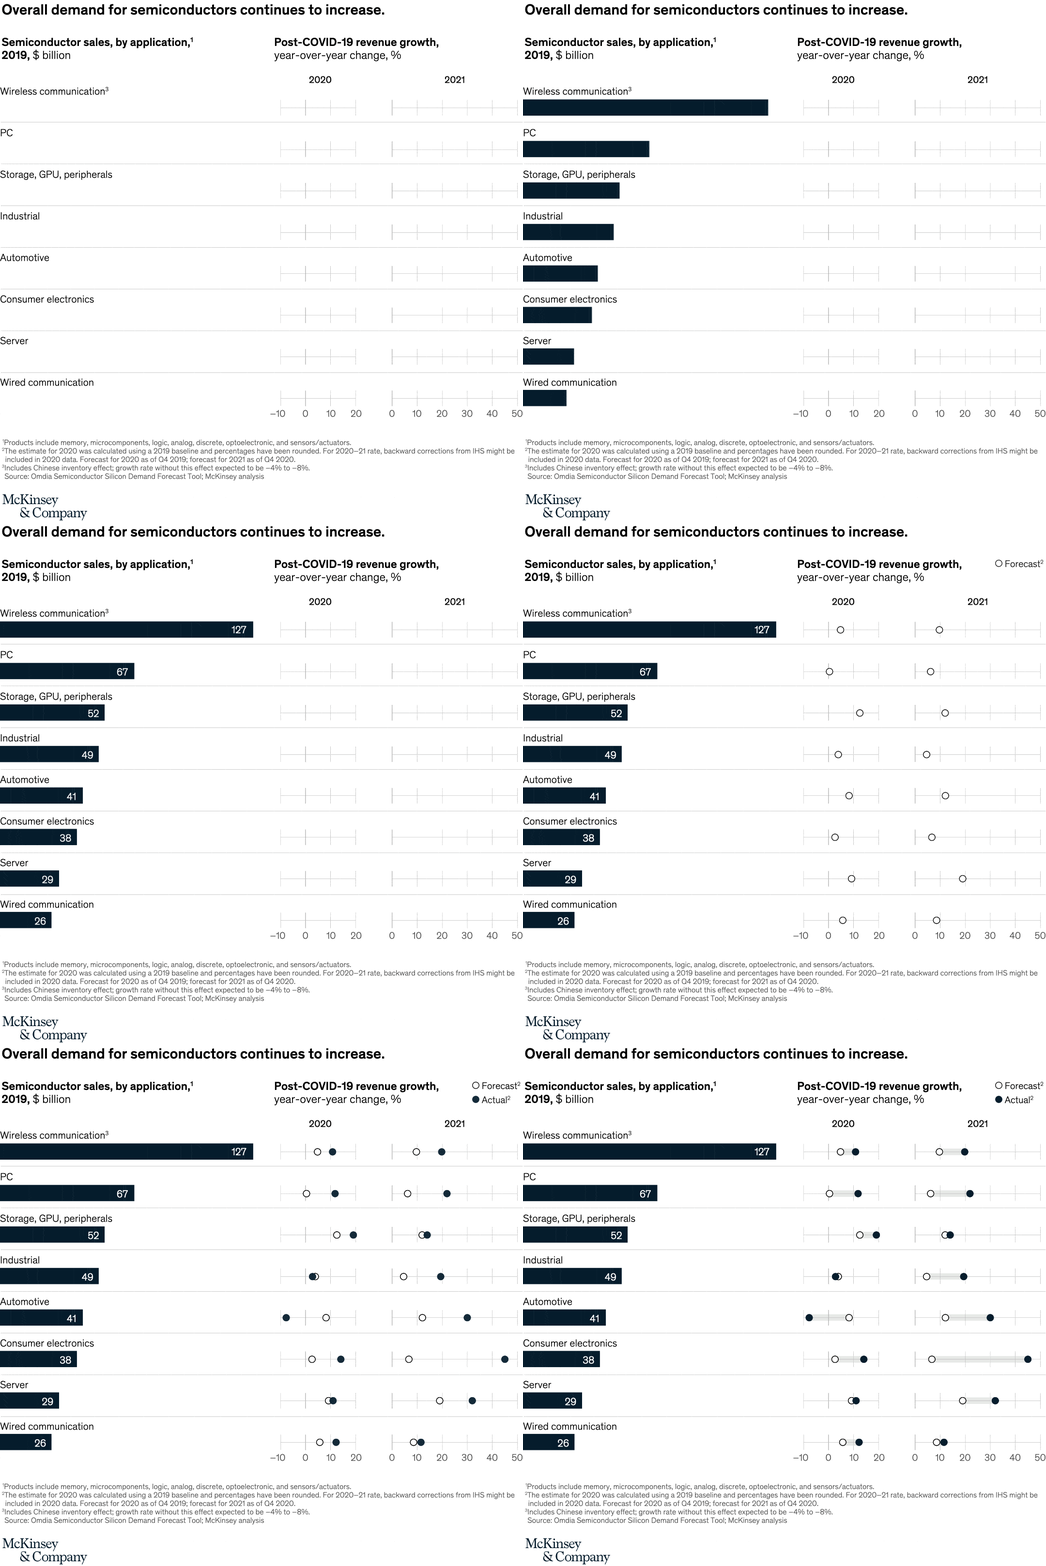
August 12, 2022 – The gap between semiconductor supply and demand has widened across multiple semiconductor-enabled products. From wireless communications and PCs to autos and consumer electronics, demand for semiconductors in 2020 and 2021 exceeded prepandemic forecasts. This is leading to increased competition across industries over a limited supply.
To read the article, see “Semiconductor shortage: How the automotive industry can succeed,” June 10, 2022.
customizer here
Visual form
Hybrid chart that combines horizontal market-size bars with two years of forecast-versus-actual dot plots.
Layout / body structure
The page is organized in rows by application. On the left, each row starts with a dark horizontal bar showing 2019 semiconductor sales; on the right, the same row continues into a 2020 mini axis and a 2021 mini axis, each with one hollow forecast dot and one filled actual dot, so the reader moves left to right across market size and then across the two annual growth comparisons.
What is being compared
The chart compares major semiconductor application groups such as Wireless communication, PC, Storage/GPU/peripherals, Industrial, Automotive, Consumer electronics, Server, and Wired communication. For each application, it contrasts prepandemic forecast growth with actual post-COVID revenue growth in 2020 and again in 2021.
Measurement system
The left panel uses 2019 semiconductor sales in billions of dollars, with row labels of 127 for Wireless communication, 67 for PC, 52 for Storage/GPU/peripherals, 49 for Industrial, 41 for Automotive, 38 for Consumer electronics, 29 for Server, and 26 for Wired communication. The right side uses year-over-year revenue growth percentages, where hollow circles are forecasts and filled circles are actual results on a scale that runs from negative territory up toward 50 percent.
Visible structure inside the graphic
Each application row is split into three visual pieces: a left market-size bar, a 2020 growth axis, and a 2021 growth axis. The forecast and actual dots are connected by pale horizontal gap bars in the later frames, which makes the overrun easy to read row by row, especially for Automotive and Consumer electronics where the filled 2021 dots sit much farther to the right than the forecast dots.
Main takeaway from the visual
The chart shows that demand did not just rise in one corner of the market; actual semiconductor revenue growth landed above forecast in most application rows in both years, and the gaps become especially wide in 2021. The cross-industry spread explains why the chip shortage became a systemwide squeeze instead of a single-sector problem.
Key standout values or extremes
Wireless communication is the largest 2019 application at $127 billion, well ahead of PC at $67 billion. On the growth side, the most dramatic 2021 overrun appears in Consumer electronics, where the actual dot lands near the far-right end of the scale while the forecast stays much closer to the low teens, and Automotive also shows a large jump from a modest forecast to an actual result around the 30 percent mark.
Controls / sequence, when applicable
This is a static chart image with no in-chart controls to operate.
Companion media, when applicable
There is no separate companion audio or video; the chart image is the full visual on this page.