Source page: McKinsey & Company
Commentary
Clean tech catch-up
Climate change | Sustainability
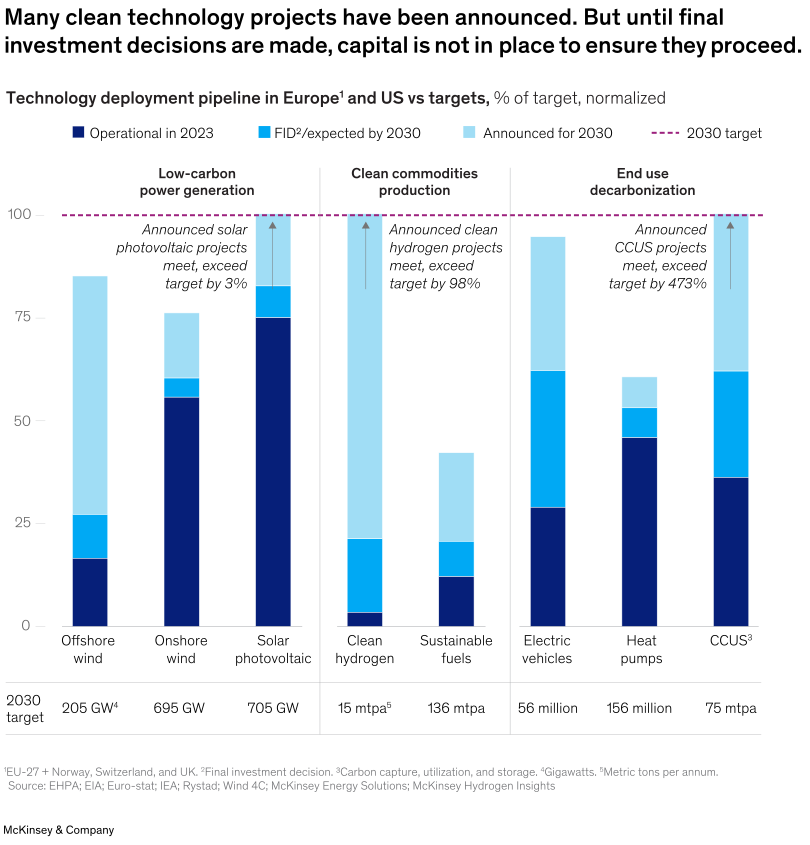
October 30, 2024 – Deployment of many clean technologies is falling short of 2030 targets. In particular, a significant proportion of announced projects have not reached the final investment decision stage where they are greenlit for capital deployment, partner Diego Hernandez Diaz and colleagues report. Renewable-energy-generation technologies, especially solar, are the closest to meeting short-term goals, while electrification technologies have seen periods of rapid growth but are now losing momentum. Many innovative technologies that could be crucial for decarbonizing hard-to-electrify sectors have ambitious project pipelines but are not yet deployed at scale.
To read the article, see “The energy transition: Where are we, really?,” August 27, 2024.
customizer here
Visual form
Grouped stacked vertical bar charts with a target reference line.
Layout / body structure
The chart is arranged in three grouped sections across the page: low-carbon power generation, clean commodities production, and end-use decarbonization. Within each group, read the stacked bars for the technology categories from left to right and compare them against the dashed 2030 target line at 100 percent.
What is being compared
It compares technology deployment pipeline stages in Europe and the United States against 2030 targets. Each stacked bar separates operational capacity in 2023, final-investment-decision or expected capacity by 2030, and announced capacity for 2030 across technologies such as offshore wind, onshore wind, solar photovoltaic, clean hydrogen, sustainable fuels, electric vehicles, heat pumps, and CCUS.
Measurement system
The bars are measured as normalized percentage of the 2030 target, so the dashed magenta line marks 100 percent. The labels beneath the chart also provide the underlying target units such as gigawatts, million units, or million tons per annum.
Visible structure inside the graphic
Each technology is represented by a stacked bar with three layers that show how much of the target is already operational, how much is at FID or expected, and how much has only been announced. The grouped layout and common target line make it easy to see which technologies already meet or exceed targets on paper and which still have large gaps.
Main takeaway from the visual
The visual shows that many clean-tech projects have been announced at levels that appear sufficient or even above target, but much less of that capacity has actually reached final investment decision or operation. The lightest top layers do much of the work in several categories, which is why the chart argues that announced capacity alone is not enough to ensure delivery.
Key standout values or extremes
Announced solar photovoltaic projects exceed the 2030 target by about 3 percent, announced clean hydrogen projects exceed target by about 98 percent, and announced CCUS projects exceed target by about 473 percent. But in categories such as clean hydrogen, sustainable fuels, and CCUS, the darker operational and FID portions remain much smaller than the full announced stack, showing the gap between announcement and committed deployment.
Controls / sequence, when applicable
This is a static chart image with no in-chart controls to operate.
Companion media, when applicable
There is no separate companion audio or video; the chart image is the full visual on this page.