Source page: McKinsey & Company
Commentary
Coastal cities face more widespread, deeper floods as climate warms
Climate change
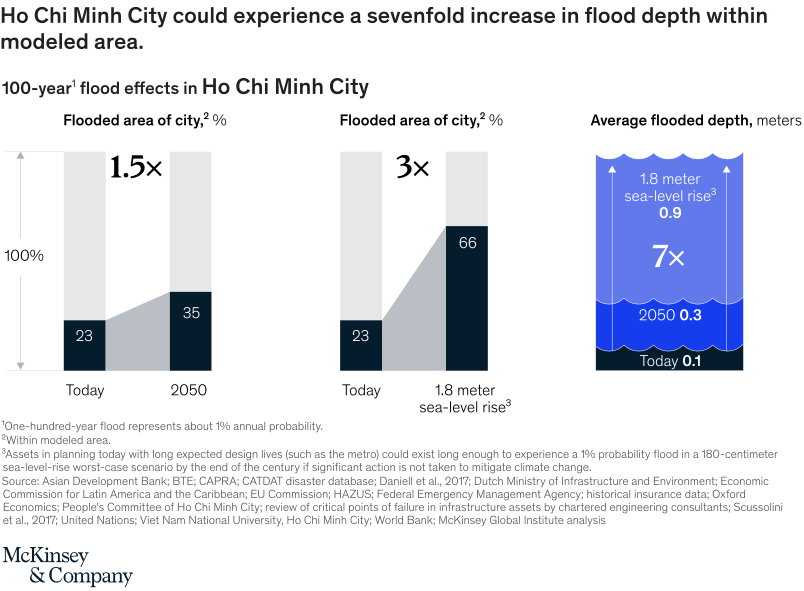
July 9, 2020 – As just one example, flooding is already part of life in Ho Chi Minh City. If a 100-year flood occurred there in 2050, it would cover 1.5 times more area than it would today. And that’s not the worst scenario.
To read the article, see “Can coastal cities turn the tide on rising flood risk?,” April 20, 2020.
customizer here
Visual form
Bar Chart: compact scenario bars for flooded area and water depth in Ho Chi Minh City.
Layout / body structure
The chart is split into compact panels. The left and center panels compare flooded area under today’s conditions, 2050 conditions, and sea-level-rise conditions, while the right panel shows average flooded depth on a vertical meter scale.
What is being compared
It compares modeled 100-year flood effects in Ho Chi Minh City under current conditions, projected 2050 conditions, and a 1.8-meter sea-level-rise scenario.
Measurement system
Flooded area is measured as percent of city area. Average flooded depth is measured in meters, allowing the chart to show both spread and severity of flooding.
Visible structure inside the graphic
The flooded-area bars increase from today to future scenarios, and the depth panel rises from a shallow current level to a much deeper sea-level-rise case.
Main takeaway from the visual
The chart shows that coastal flood risk becomes both wider and deeper as climate conditions change. Ho Chi Minh City faces not only more flooded area but also much greater average flood depth in the severe sea-level-rise case.
Key standout values or extremes
Flooded area rises from 23 percent today to 35 percent in 2050, a 1.5-times increase. Under 1.8 meters of sea-level rise, flooded area reaches 66 percent and average depth rises to 0.9 meters, seven times today’s 0.1 meter.
Controls / sequence, when applicable
This is a static bar-chart comparison; there are no in-chart controls to operate.
Companion media, when applicable
There is no separate companion audio or video; the flood-risk bar chart is the full visual on this page.