Source page: McKinsey & Company
Commentary
Coming out at work isn’t something you do once—and it’s harder for some than others
Inequality | Diversity & Inclusion
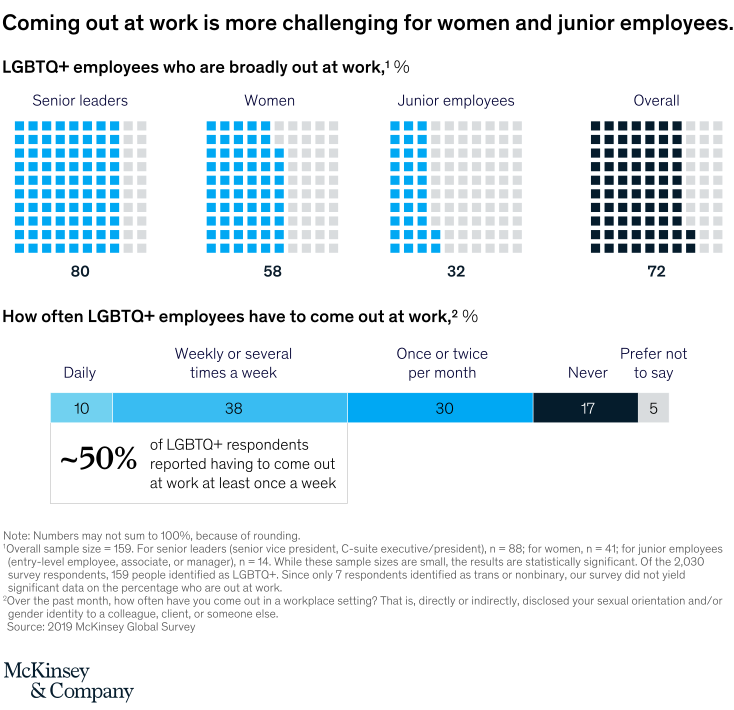
October 16, 2020 – More than one in four LGBTQ+ employees are not broadly out at work—and those who are report having to come out again and again. Women and employees in junior roles have a harder time doing this.
To read the article, see “LGBTQ+ voices: Learning from lived experiences,” June 25, 2020.
customizer here
Visual form
Bar Chart: two-panel LGBTQ+ workplace survey comparison for outness and repeated disclosure frequency.
Layout / body structure
The first panel compares how broadly different LGBTQ+ employee groups are out at work. The second panel shows how often LGBTQ+ employees have to come out again in workplace situations.
What is being compared
It compares senior leaders, women, junior employees, and the overall LGBTQ+ sample on broad outness at work, then compares daily, weekly, occasional, and never frequency categories for repeated coming out.
Measurement system
The measure is survey percentage. The first panel reports percent broadly out at work, and the second panel reports percent distribution across repeated-disclosure frequency categories.
Visible structure inside the graphic
The subgroup bars show senior leaders much higher than junior employees. The frequency panel shows that repeated coming out is common rather than rare.
Main takeaway from the visual
The chart shows that coming out at work is an ongoing burden, and that it is harder for some groups, especially women and junior employees.
Key standout values or extremes
Senior leaders are 80 percent broadly out at work, compared with 72 percent overall, 58 percent for women, and 32 percent for junior employees. Ten percent come out daily, and 38 percent do so weekly or several times a week.
Controls / sequence, when applicable
This is a static two-panel survey bar chart; there are no in-chart controls to operate.
Companion media, when applicable
There is no separate companion audio or video; the coming-out-at-work survey chart is the full visual on this page.