Source page: McKinsey & Company
Commentary
Companies play catch-up on cybersecurity
Cybersecurity | Technology
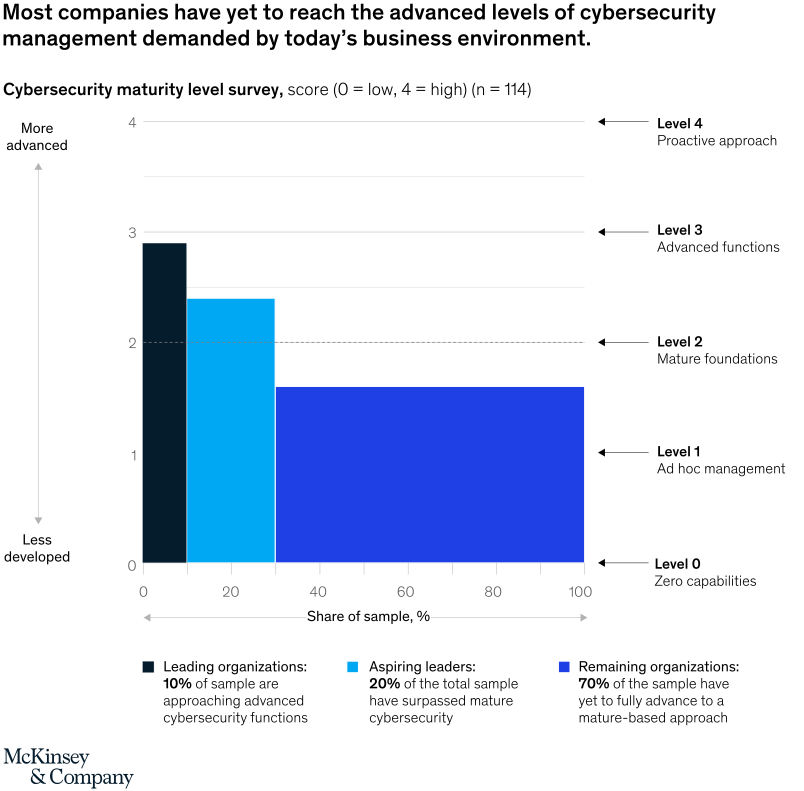
August 16, 2021 – Companies’ cybersecurity measures aren’t keeping pace with today’s business environment demands. A recent survey by McKinsey found that among 100 companies across various industries, only about 10 percent take aim at cyberrisk reduction. Most—about 70 percent—are more reactionary, filling security gaps as they arise.
To read the article, see “Organizational cyber maturity: A survey of industries,” August 4, 2021.
customizer here
Visual form
Horizontal share-distribution block chart.
Layout / body structure
The chart is a single wide block chart read from left to right across the sample share axis while also using the vertical position of each colored block to show maturity level. Read the colored sections across the 0 to 100 percent width and then use the right-side maturity labels to see where each group sits on the 0-to-4 scale.
What is being compared
The chart compares three groups of organizations by cybersecurity maturity: leading organizations, aspiring leaders, and remaining organizations. It compares both how large each group is in the sample and what maturity band each group occupies.
Measurement system
The horizontal axis is share of sample in percent, and the vertical axis is cybersecurity maturity score from 0 to 4. A dotted line marks level 2, labeled mature foundations, and the right-side labels define each maturity band from zero capabilities up to proactive approach.
Visible structure inside the graphic
A short dark block at the left marks leading organizations, a medium cyan block in the center marks aspiring leaders, and a long royal-blue block fills the rest of the width for remaining organizations. Each block sits at a different height on the maturity scale, and the legend beneath the plot repeats the group definitions with their sample shares.
Main takeaway from the visual
Most companies still sit below the advanced end of the maturity ladder. The longest block belongs to the remaining organizations group and it sits down near level 1 to 2, which makes the distribution visibly bottom-heavy rather than concentrated among advanced leaders.
Key standout values or extremes
Leading organizations account for 10 percent of the sample and sit close to level 3, aspiring leaders make up 20 percent and sit around the mid-2s, and remaining organizations make up 70 percent and sit around 1.6. The level-2 line cuts through the display to show that only the first two groups are at or above mature foundations, while the largest group remains below that threshold.
Controls / sequence, when applicable
This is a static chart image with no in-chart controls to operate.
Companion media, when applicable
There is no separate companion audio or video; the chart image is the full visual on this page.