Source page: McKinsey & Company
Commentary
Companies that take steps to improve resiliency now could see benefits for years
COVID-19 | Strategy
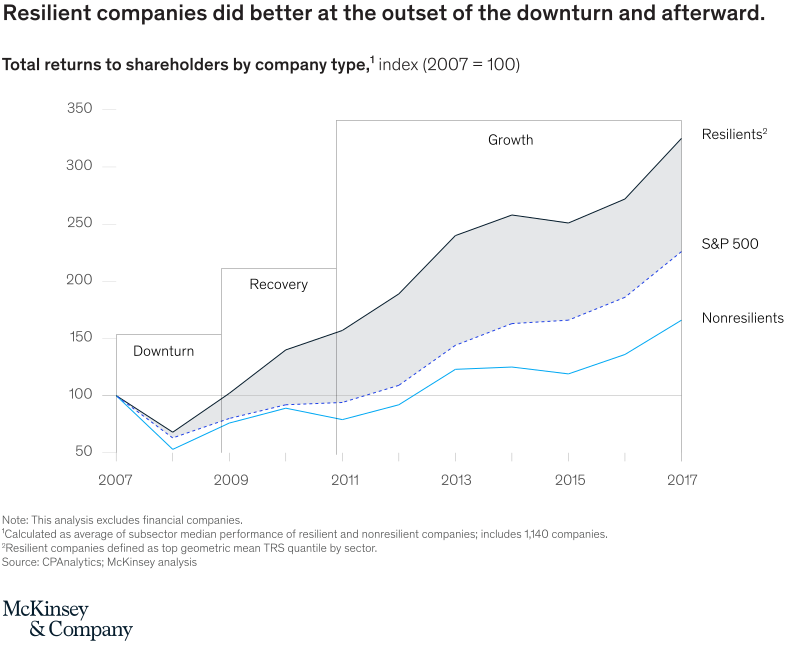
October 7, 2020 – Companies that intervened early during the last financial crisis continued to outperform their peers—and widen their lead—for at least a decade.
To read the article, see “As you return from the summer break, can you lead toward a COVID-Exit?,” September 25, 2020.
customizer here
Visual form
Index Chart: multi-line indexed performance comparison for resilient companies versus peers.
Layout / body structure
The chart uses one shared timeline running from the downturn into the recovery years. Each line starts from a common indexed baseline so the relative paths can be compared over time.
What is being compared
It compares corporate performance for resilient companies against less resilient companies or the broader peer set during and after the previous financial crisis.
Measurement system
The vertical scale is indexed performance rather than raw dollars. A common baseline shows how each group falls, recovers, and diverges after the downturn.
Visible structure inside the graphic
The resilient-company line separates from the other lines near the crisis and stays above them through the recovery period. The key visual feature is the widening gap over time.
Main takeaway from the visual
The chart shows that resilience actions can affect the entire recovery path, not only the initial crisis response. Companies that moved early kept outperforming for years.
Key standout values or extremes
The strongest visual anchor is the resilient group remaining above peers for at least a decade after the downturn, with the gap widening rather than closing.
Controls / sequence, when applicable
This is a static indexed line chart; there are no in-chart controls to operate.
Companion media, when applicable
There is no separate companion audio or video; the resilient-company performance chart is the full visual on this page.