Source page: McKinsey & Company
Commentary
Consumer confidence roller coaster
Asia-Pacific | Consumer | Retail
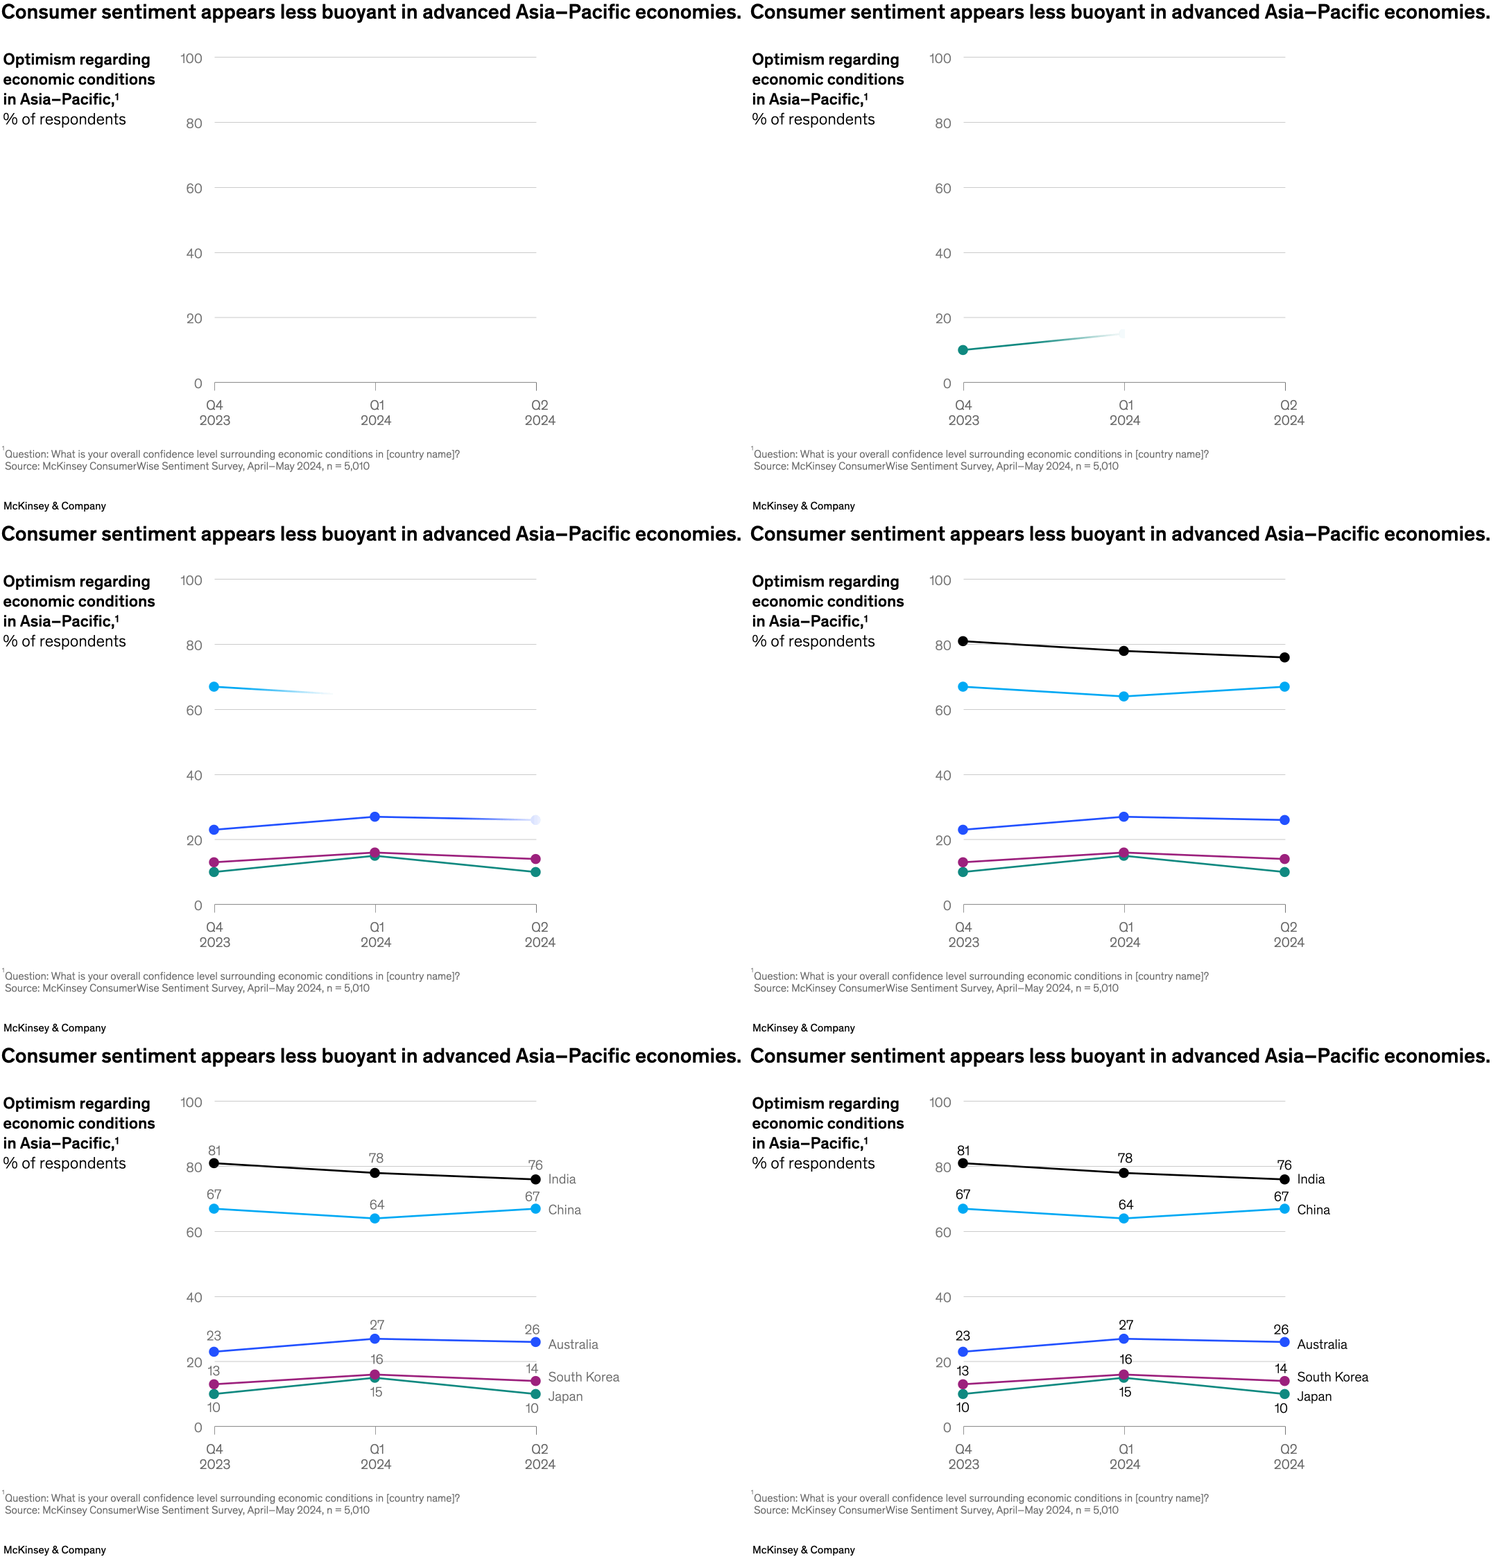
August 6, 2024 – Consumer confidence has been up and down in Asia–Pacific markets in recent months and is trending downward in most of these economies. Partner Abhishek Malhotra and colleagues note that while consumers in Australia, Japan, and South Korea indicate declining optimism, results are more mixed among consumers in China and India. In China, consumer confidence rose primarily due to younger generations’ optimism, while India’s consumer confidence dipped ahead of the recent national election.
To read the article, see “An update on consumer sentiment in Asia–Pacific,” July 2, 2024.
customizer here
Visual form
Multi-series line chart.
Layout / body structure
The visual is a single chart with five country lines plotted across three quarterly points, read left to right from Q4 2023 to Q2 2024, with direct labels on the right edge naming each country.
What is being compared
It compares optimism regarding economic conditions across India, China, Australia, South Korea, and Japan over three consecutive survey waves.
Measurement system
The vertical axis is the percent of respondents expressing optimism, and the horizontal axis is split into Q4 2023, Q1 2024, and Q2 2024.
Visible structure inside the graphic
Each country is drawn as its own colored line with dot markers and printed values at every point, and the direct labeling on the final quarter makes the separation between the high-confidence and low-confidence country groups immediately visible.
Main takeaway from the visual
India and China sit far above the advanced Asia-Pacific economies across the whole chart, while Australia, South Korea, and Japan remain clustered much lower, which is why the page frames advanced Asia-Pacific sentiment as less buoyant.
Key standout values or extremes
India moves from 81 to 78 to 76, China from 67 to 64 to 67, Australia from 23 to 27 to 26, South Korea from 13 to 16 to 14, and Japan from 10 to 15 to 10, leaving a very large gap between the top two lines and the rest.
Controls / sequence, when applicable
This is a static chart image with no in-chart controls to operate.
Companion media, when applicable
There is no separate companion audio or video; the chart image is the full visual on this page.