Source page: McKinsey & Company
Commentary
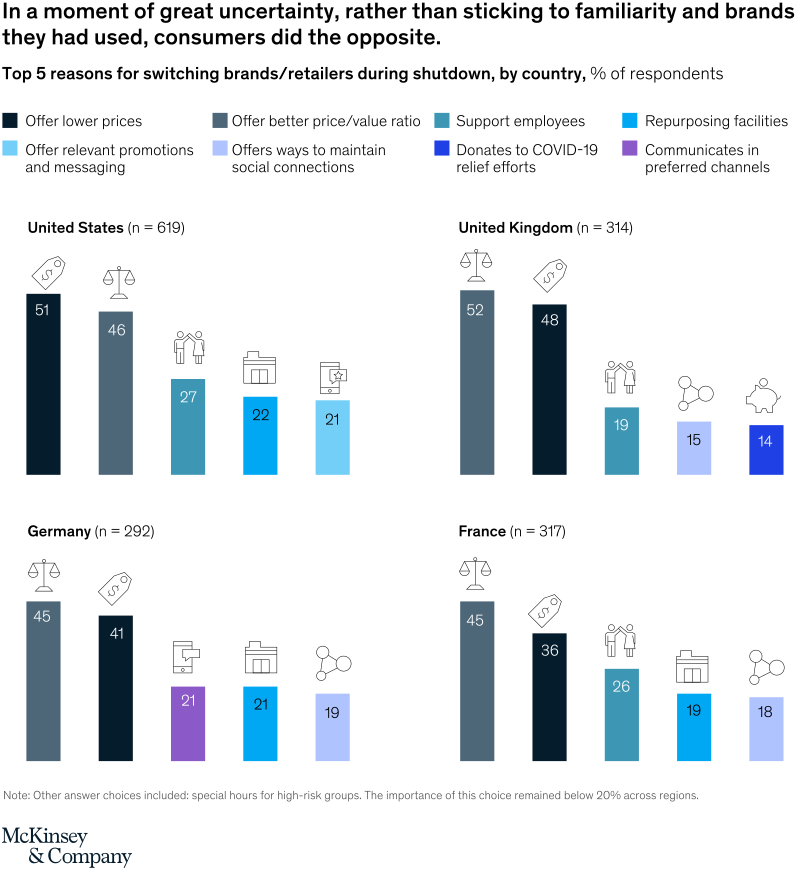
Consumers who switched brands during the pandemic most often cited price and value
COVID-19 | Retail
September 8, 2020 – Shoppers also rewarded brands or retailers that supported their employees and those that repurposed their facilities to help slow the spread of the virus.
To download the full report, see “Retail Reimagined: The new era for customer experience,” August 2020 (registration required).
customizer here
Visual form
Multi-panel country bar chart.
Layout / body structure
The chart is arranged as a grid of country panels beneath a shared legend. Read the legend first to understand the color-coded reasons, then scan country by country from left to right and top to bottom, reading the five bars inside each country panel from tallest to shortest.
What is being compared
The chart compares the top five reasons consumers gave for switching brands or retailers during shutdown across countries. Each country panel shows which motivations were most frequently cited, including price or value reasons and several pandemic-response or brand-behavior reasons.
Measurement system
The measure is percent of respondents, and each country label includes its sample size. The bars are color-coded to match the legend categories, so the reader tracks both rank and stated reason at the same time.
Visible structure inside the graphic
A legend across the top lists the reason categories with matching colors and icons. Below it, each country panel shows five vertical bars with the numeric value printed on the bar, making it easy to compare which reasons dominate within the United States, United Kingdom, Germany, and France.
Main takeaway from the visual
The chart shows that consumers who switched did not mainly switch for vague novelty or familiarity-breaking behavior. In the visible country panels, price and value reasons dominate, while support for employees and other pandemic-era brand actions matter but sit below the top economic triggers.
Key standout values or extremes
In the United States panel, the top two bars are 51 and 46, corresponding to lower prices and better price or value ratio, followed by 27 for support employees and then lower bars at 22 and 21. In the United Kingdom panel, the top two bars are again price-and-value led at 52 and 48, after which the next three reasons drop to 19, 15, and 14.
Controls / sequence, when applicable
This is a static chart image with no in-chart controls to operate.
Companion media, when applicable
There is no separate companion audio or video; the chart image is the full visual on this page.