Source page: McKinsey & Company
Commentary
Convenient but costly
Retail | E-commerce
June 2, 2022 – E-commerce has to offer more than convenience to keep grocery shoppers coming back. Our recent research shows that fewer consumers—compared with 2020—want to engage with retailers in person. But online grocery shoppers say e-commerce falls short in providing fresh, quality foods, lacks a robust selection, and is too expensive overall.
To read the article, see “The next horizon for grocery e-commerce: Beyond the pandemic bump,” April 29, 2022.
customizer here
Visual form
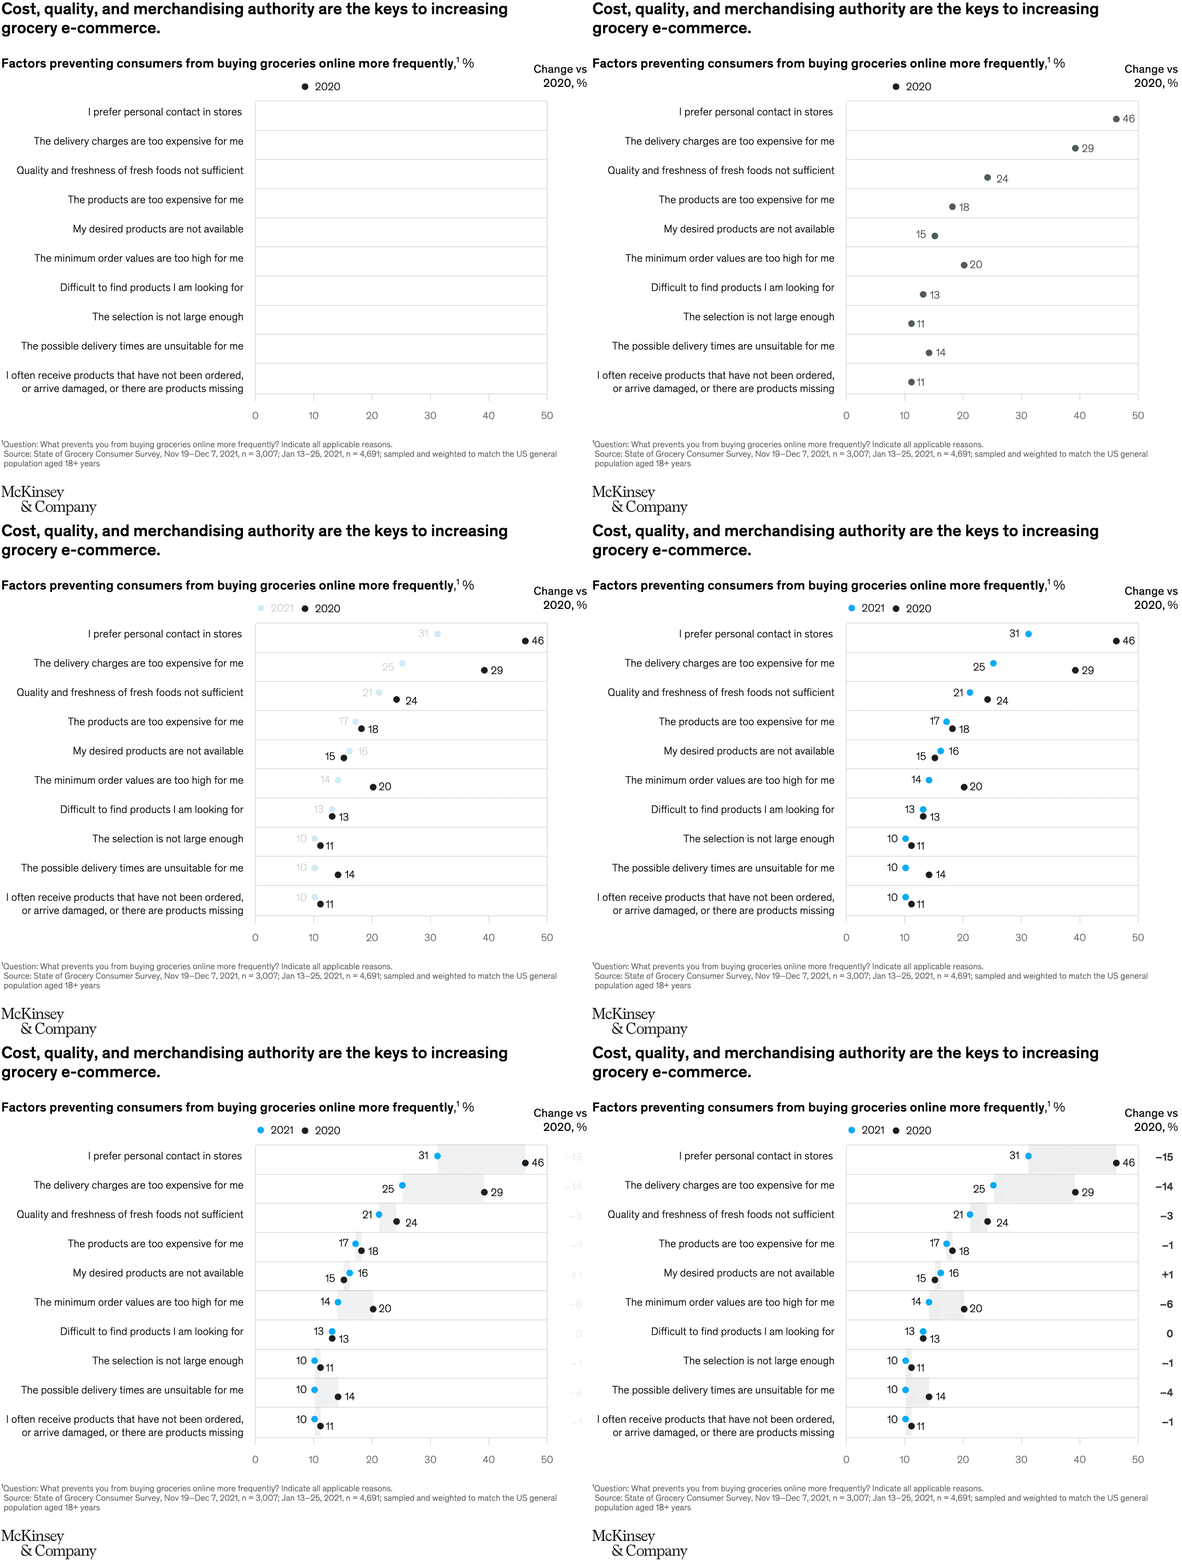
Ranked two-series dot comparison chart.
Layout / body structure
The chart is a single top-to-bottom list of purchase barriers, with one row per reason. Read down the ranked reasons, compare the blue 2021 dot against the dark 2020 dot within each row, and then finish on the change-versus-2020 column on the far right.
What is being compared
Each row compares how often consumers cite a given obstacle to buying groceries online more frequently, including preference for personal contact, delivery fees, freshness concerns, price, availability, minimum order size, search difficulty, selection, delivery timing, and damaged or missing goods.
Measurement system
Everything is shown as percent of respondents. The blue dot marks 2021, the dark dot marks 2020, the horizontal gray guide indicates the gap between the two years, and the rightmost change column converts that gap into percentage-point change versus 2020.
Visible structure inside the graphic
Ten ranked rows line up on a common horizontal scale from 0 to 50, with two dots and a connector band on each row. The longest separations sit at the top of the chart, and the right edge lists the signed year-over-year change for each factor.
Main takeaway from the visual
The biggest friction points in grocery e-commerce remain personal contact, delivery cost, and freshness, but nearly all of them eased relative to 2020 rather than worsening. The only factor that nudges upward is desired products not being available, which suggests availability problems have not improved with the rest of the experience.
Key standout values or extremes
Preference for personal contact drops from 46 percent in 2020 to 31 percent in 2021, a 15-point decline, and delivery charges fall from 29 percent to 25 percent, down 14 points. Freshness concerns move from 24 percent to 21 percent, minimum order values from 20 percent to 14 percent, and possible delivery times from 14 percent to 10 percent. The lone increase is desired products not being available, rising from 15 percent to 16 percent.
Controls / sequence, when applicable
This is a static chart image with no in-chart controls to operate.
Companion media, when applicable
There is no separate companion audio or video; the chart image is the full visual on this page.