Source page: McKinsey & Company
Commentary
Copper’s circular supply solution
Metals and mining | Sustainability
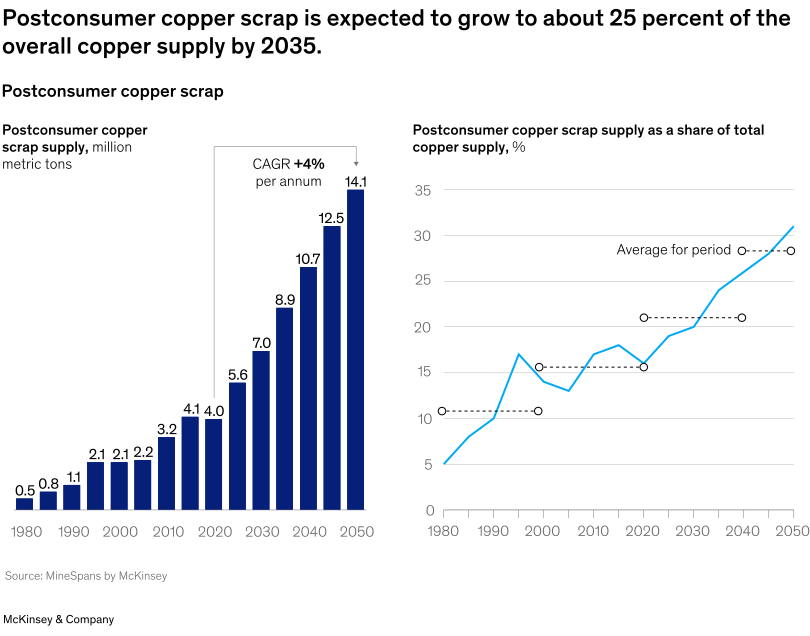
July 16, 2025 – As companies pursue carbon neutrality, a copper supply deficit looms. Copper recycling, such as through the recovery of postconsumer copper scrap, could help ease supply constraints. The volume of postconsumer copper scrap has increased steadily for 40 years, Partner Sergey Sokolov and colleagues note, adding that it is projected to grow by about 4 percent annually through 2050. The increased use of scrap is due to multiple factors, including more governments and consumers advocating for a circular economy and an increased awareness of the CO2 emissions generated by metal extraction and refining.
To read the article, see “Chasing the lost copper: Global scrap and its role in decarbonization,” June 3, 2025.
customizer here
Visual form
Two-panel chart combining a bar chart with a line chart.
Layout / body structure
The chart is laid out left to right. The left panel is a historical and projected bar chart of postconsumer copper scrap supply, and the right panel is a time-series line chart showing postconsumer scrap as a share of total copper supply.
What is being compared
It compares the growth of postconsumer copper scrap in absolute volume over time and then compares how that scrap volume changes as a percentage of total copper supply from the 1980s through 2050.
Measurement system
The left chart uses million metric tons, while the right chart uses percentage share of total copper supply. The left panel also calls out a CAGR of 4 percent per annum for the forward growth period.
Visible structure inside the graphic
The left panel uses vertical bars that rise from very small values in the 1980s to much taller bars by 2050, with labels such as 0.5, 2.1, 4.1, 7.0, 10.7, 12.5, and 14.1. The right panel uses a blue line that climbs from the low single digits to above 30 percent by 2050, with dotted horizontal average markers for multi-year periods. Together the two panels show the same trend in both volume and share terms.
Main takeaway from the visual
The chart shows that postconsumer copper scrap is becoming a much larger and more important part of total copper supply. The trend is not just gradual volume growth; it is a structural increase in scrap’s role in the overall copper system.
Key standout values or extremes
Postconsumer scrap supply rises to 14.1 million metric tons by 2050 in the left panel. On the right, scrap’s share moves toward about 25 percent by 2035 and rises above 30 percent by 2050. The chart also highlights a 4 percent annual growth rate for the projected period.
Controls / sequence, when applicable
This is a static chart image with no in-chart controls to operate.
Companion media, when applicable
There is no separate companion audio or video; the chart image is the full visual on this page.