Source page: McKinsey & Company
Commentary
Coronavirus is accelerating digital-strategy formulation
COVID-19 | Digital | Strategy
May 7, 2020 – Businesses that once mapped digital strategy in one- to three-year phases must now scale their initiatives in a matter of days or weeks. Leadership teams need to learn quickly what is and is not working, and why. This requires identifying and learning about unknown elements as quickly as they appear. Our survey of 1,500 executives showed that, before the crisis, the best-performing companies—those in the top decile for organic growth—had already been moving faster across a range of activities to help them learn faster. Companies can look to their example as they work to adapt to change more rapidly during crisis times—and beyond.
To read the article, see “Digital strategy in a time of crisis,” April 2020.
customizer here
Visual form
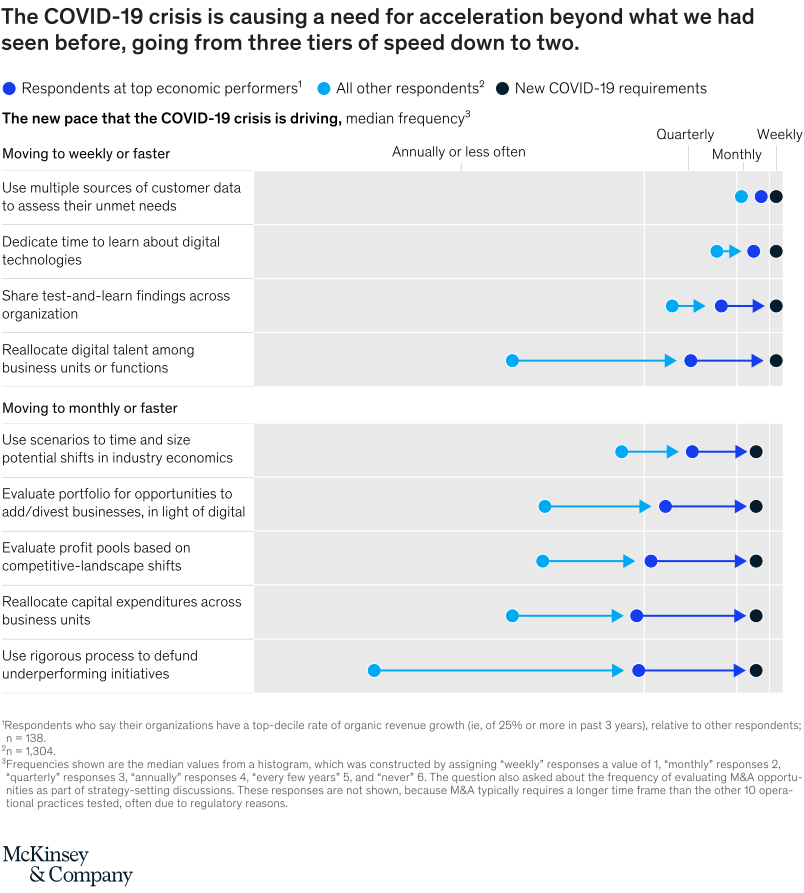
Scatter Plot: horizontal dot-and-arrow matrix of digital-strategy cadence before and during COVID-19.
Layout / body structure
The chart is arranged as rows of business actions grouped by digital learning and strategic-response behaviors. Each row places dots on a horizontal frequency scale, then uses arrows to show how the cadence moved from the pre-crisis pace to the crisis-response pace.
What is being compared
It compares how often organizations performed specific digital and strategy actions before COVID-19 with how often those actions needed to happen during the crisis. It also contrasts top organic-growth performers with other respondents where the chart separates those groups.
Measurement system
The horizontal scale is cadence: annually or less often, quarterly, monthly, and weekly. Dot position shows the reported pace, and arrow length shows how far that behavior accelerated.
Visible structure inside the graphic
Most rows move to the right, toward monthly or weekly action. The strongest movement appears in actions such as reallocating digital talent, using scenarios, evaluating portfolio opportunities, reallocating capital, and defunding underperforming initiatives.
Main takeaway from the visual
COVID-19 compressed digital-strategy cycles. Work that had often been reviewed annually, quarterly, or monthly was pushed toward weekly decision-making, especially for actions tied to learning quickly and redirecting resources.
Key standout values or extremes
The rightmost end of the graphic is the weekly cadence, and many arrows point toward it. The largest visual jumps are not just customer-facing digital moves; they also include portfolio review, capital reallocation, talent reallocation, and stopping underperforming initiatives.
Controls / sequence, when applicable
This is a static scatter-plot matrix; there are no in-chart controls to operate.
Companion media, when applicable
There is no separate companion audio or video; the scatter-plot matrix is the full visual on this page.