Source page: McKinsey & Company
Commentary
Corporations take a stand
Strategy | Europe | Global Trade
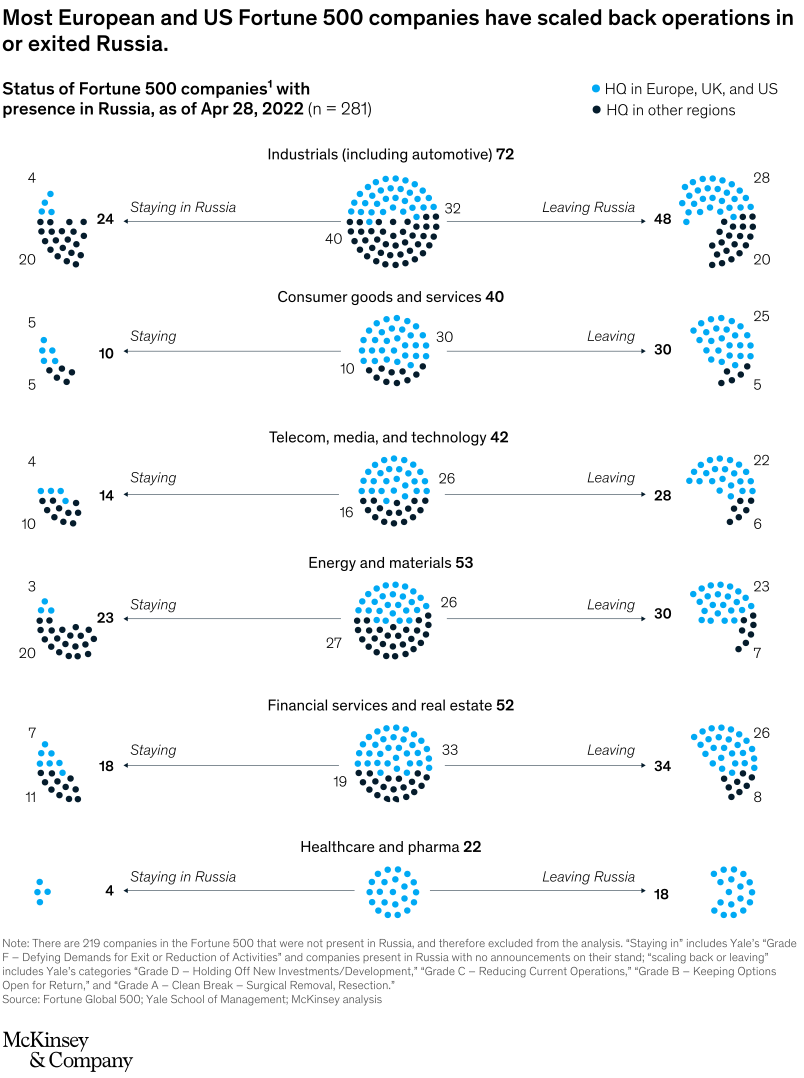
June 29, 2022 – The corporate sector reacted swiftly to Russia’s invasion of Ukraine. Among businesses based in Europe, the United Kingdom, and the United States, nearly 85 percent left or scaled back their operations in Russia. And 70 percent of the Fortune 500 companies that operated in Russia prior to the war opted to leave or scale back their business once the conflict began.
To read the article, see “War in Ukraine: Twelve disruptions changing the world,” May 9, 2022.
customizer here
Visual form
Grouped dot-matrix infographic.
Layout / body structure
The chart is arranged as vertically stacked sector clusters built from individual company dots, with the before-and-after breakup running across the page rather than on axes. Reader moves through the sector stacks and then follows the directional split that separates companies still in Russia from companies that left or scaled back after the invasion.
What is being compared
The visual compares Fortune 500 companies that had a presence in Russia, broken out by area of production, by headquarters location, and then by post-invasion response. One color represents companies headquartered in Europe, the United Kingdom, or the United States, while the other color represents companies headquartered elsewhere.
Measurement system
This graphic does not use axes. It measures scale through the number of dots in each sector cluster, uses color to distinguish headquarters region, and uses directional separation to show whether companies remained in Russia or exited or scaled back operations.
Visible structure inside the graphic
Each sector is shown as a circular group of dots, and those groups are stacked one above another into tall columns. The same two-color pattern repeats across the chart so the eye can compare who was present before the invasion and how that group splits afterward into those that stayed versus those that left or curtailed activity.
Main takeaway from the visual
The dominant visual impression is the imbalance between the large clusters that move into the leaving-or-scaling-back side and the much smaller set that remains. The Europe, UK, and US cohort drives that shift most visibly, which makes the corporate retreat from Russia readable at a glance.
Key standout values or extremes
The chart does not foreground numeric axis labels, so the strongest extremes are spatial rather than numeric: many more dots accumulate in the left-or-scaled-back outcome than in the stayed-in-Russia outcome. The sector stacks also show that this pattern is repeated across multiple industries rather than being confined to a single vertical.
Controls / sequence, when applicable
This is a static chart image with no in-chart controls to operate.
Companion media, when applicable
There is no separate companion audio or video; the chart image is the full visual on this page.