Source page: McKinsey & Company
Commentary
COVID-19 is causing a backlog of elective surgeries
COVID-19 | Healthcare
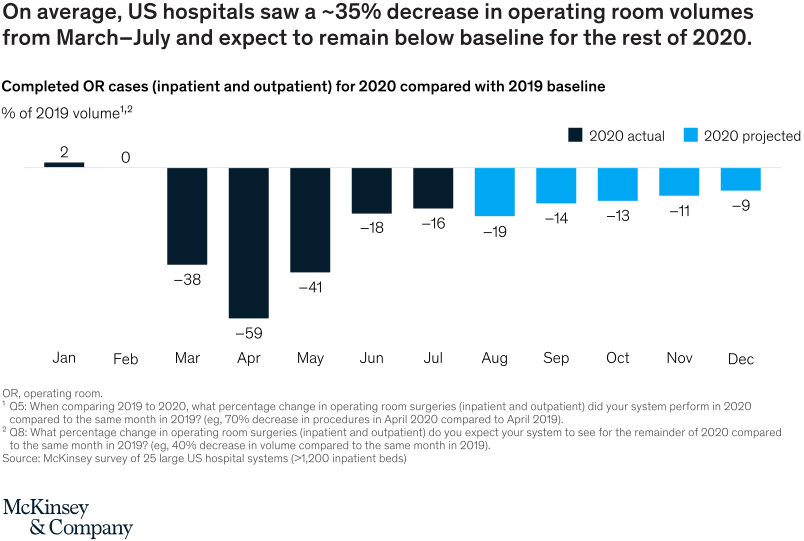
October 13, 2020 – Our July survey of 25 large US hospital systems—representing a quarter of the country’s hospital beds—showed large decreases in surgeries this year as compared with 2019. The trend is expected to continue at least through the end of 2020.
To read the article, see “Cutting through the COVID-19 surgical backlog,” October 2, 2020.
customizer here
Visual form
Line Chart: operating-room volume time series against a 2019 baseline.
Layout / body structure
The chart reads left to right across 2020. It starts near normal operating-room volume, drops sharply during the spring pandemic shutdowns, and then shows an incomplete recovery through the rest of the year.
What is being compared
It compares 2020 operating-room volume at large US hospital systems with 2019 baseline levels to show how elective-surgery activity changed during COVID-19.
Measurement system
The measure is operating-room volume as a percent of historical baseline. The key comparison is the drop from March through July and the projected return only to baseline afterward.
Visible structure inside the graphic
The time path falls steeply during the early pandemic period and then flattens near baseline rather than rising above it. That shape makes the backlog visible because lost procedures are not offset by higher later throughput.
Main takeaway from the visual
The chart shows that elective surgeries were deferred faster than hospitals were expected to catch up, creating a backlog that could persist beyond the initial shutdown period.
Key standout values or extremes
The main anchor is an approximately 35 percent decrease in operating-room volume from March through July compared with 2019. The recovery path is expected to remain around baseline rather than materially above it.
Controls / sequence, when applicable
This is a static operating-volume line chart; there are no in-chart controls to operate.
Companion media, when applicable
There is no separate companion audio or video; the elective-surgery volume chart is the full visual on this page.