Source page: McKinsey & Company
Commentary
COVID-19 recovery in hardest-hit sectors could take more than 5 years
COVID-19 | Economics
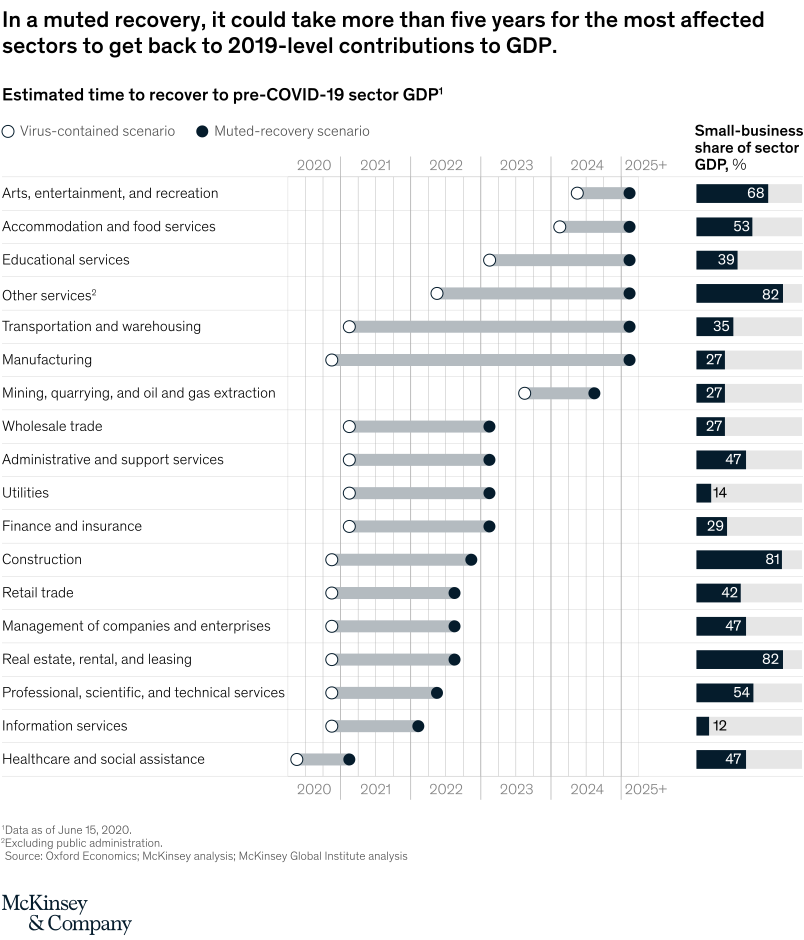
July 29, 2020 – If the economic recovery from COVID-19 is muted (one of two scenarios executives view as most likely), some industries will take years to get back to their prepandemic normal. Many in those industries are small businesses, and their recovery may take even longer, if at all.
To read the article, see “US small-business recovery after the COVID-19 crisis,” July 7, 2020.
customizer here
Visual form
Scatter Plot and Bar Chart: sector recovery-timeline dots with small-business share bars.
Layout / body structure
Each sector is a row. The main timeline places dots for estimated return to pre-COVID-19 sector GDP under virus-contained and muted-recovery scenarios, while the right column uses small bars to show each sector’s small-business share of GDP.
What is being compared
It compares recovery timing across hard-hit sectors, including arts and entertainment, accommodation and food services, education, transportation, manufacturing, construction, retail, real estate, professional services, information, and healthcare.
Measurement system
The timeline uses calendar years from 2020 through 2025-plus. The right-side bars measure small-business share of sector GDP as percent.
Visible structure inside the graphic
Muted-recovery dots often extend farther right, sometimes to 2025-plus, while virus-contained dots generally sit earlier. Several service sectors combine long recovery timelines with high small-business exposure.
Main takeaway from the visual
The chart shows that recovery speed varies sharply by sector and scenario. In a muted recovery, several hard-hit sectors could take more than five years to regain 2019-level GDP contributions.
Key standout values or extremes
Arts, entertainment, and recreation; other services; construction; and real estate show long recovery timelines. The right-side share bars reach high levels such as 82 percent for other services and real estate and 81 percent for construction.
Controls / sequence, when applicable
This is a static recovery-timeline scatter plot with share bars; there are no in-chart controls to operate.
Companion media, when applicable
There is no separate companion audio or video; the sector recovery chart is the full visual on this page.