Source page: McKinsey & Company
Commentary
COVID-19’s hit to women’s jobs could cost the world $1 trillion by 2030
COVID-19 | Diversity & Inclusion
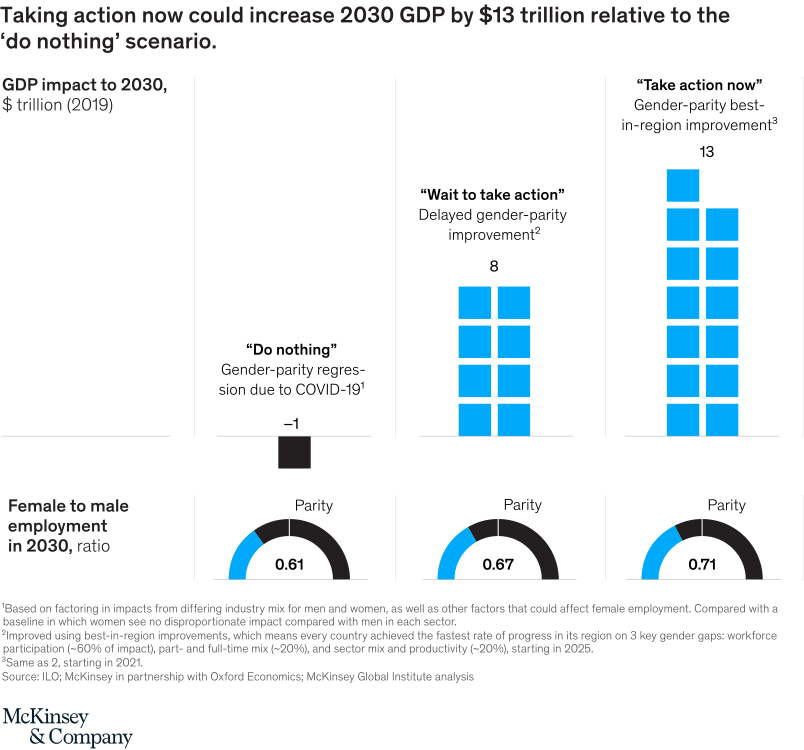
July 24, 2020 – In a scenario where nothing’s done to address gender parity in the workplace during the current crisis, the cost is high. Taking action on the issue now could add $13 trillion to global GDP in ten years, compared with the “do nothing” scenario.
To read the article, see “COVID-19 and gender equality: Countering the regressive effects,” July 15, 2020.
customizer here
Visual form
Bar Chart and Single KPI / Metric: three-scenario GDP columns with female-to-male employment-ratio gauges.
Layout / body structure
The chart places three scenarios left to right: do nothing, wait to take action, and take action now. The upper column blocks show GDP impact, while the lower semicircle gauges show the female-to-male employment ratio projected for 2030.
What is being compared
It compares the global GDP and employment-parity outcomes of different responses to COVID-19’s effect on women’s jobs. The scenarios show the difference between inaction, delayed action, and immediate action.
Measurement system
GDP impact is measured in trillions of 2019 dollars through 2030. The gauges show the female-to-male employment ratio, with higher values closer to parity.
Visible structure inside the graphic
The do-nothing scenario drops below zero, while the wait and take-action scenarios rise as positive blue blocks. The parity gauges improve across the scenarios but still remain below full parity.
Main takeaway from the visual
The chart shows that delaying or ignoring gender-parity action has a large economic cost. Taking action now produces the strongest GDP outcome and the best employment-ratio result among the three scenarios.
Key standout values or extremes
Do nothing shows a negative 1 trillion dollar GDP impact. Waiting shows 8 trillion dollars, while taking action now shows 13 trillion dollars and a 0.71 female-to-male employment ratio.
Controls / sequence, when applicable
This is a static scenario bar chart with KPI-style parity gauges; there are no in-chart controls to operate.
Companion media, when applicable
There is no separate companion audio or video; the scenario chart is the full visual on this page.