Source page: McKinsey & Company
Commentary
Crazy for crypto but allergic to risk?
Cryptocurrency | Banking
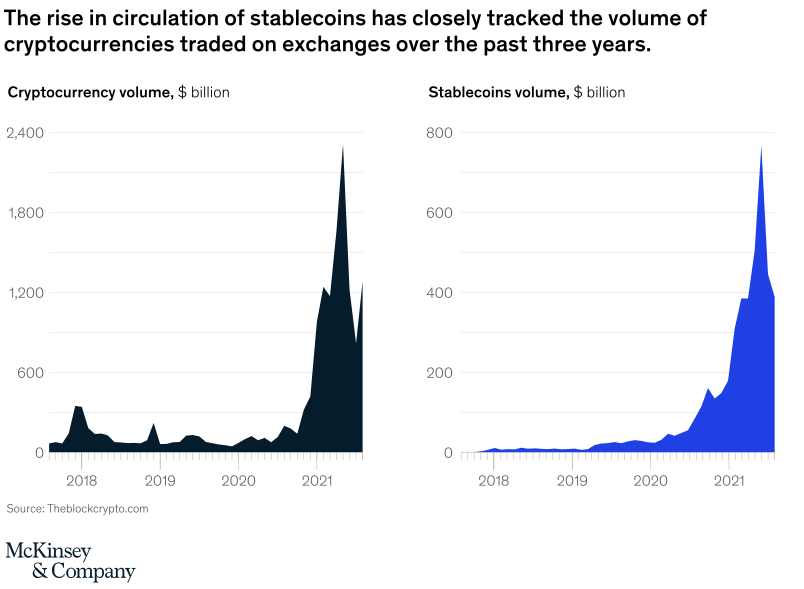
December 1, 2021 – For the risk-averse, stablecoins—multiple private, stabilized cryptocurrencies—are a less volatile form of digital currency. Stablecoins gained steam during the first half of 2021, with nearly $3 trillion traded on exchanges.
To read the article, see “CBDC and stablecoins: Early coexistence on an uncertain road,” October 11, 2021.
customizer here
Visual form
Two-panel area time-series chart.
Layout / body structure
The chart places cryptocurrency volume on the left and stablecoins volume on the right, both running across the same 2018 to 2021 time span. Reader follows the shape of each filled area from left to right and then compares the timing and magnitude of the two spike patterns across the two panels.
What is being compared
The chart compares total cryptocurrency trading volume with total stablecoin circulation or volume over the past three years. It is a like-for-like time comparison intended to show how closely the stablecoin series tracks the broader crypto market’s trading surge.
Measurement system
Both panels are measured in billions of dollars. The left panel’s scale rises to about 2,400 billion, while the right panel rises to about 800 billion, and the filled areas show how volume changes over time rather than plotting separate categories or series lines.
Visible structure inside the graphic
Each panel uses a single filled area with the same overall contour: low early values, a modest rise around 2020, and a much steeper vertical climb in 2021 followed by a pullback. The left shape is much taller in absolute terms, but the right shape mirrors the same surge-and-cooldown pattern closely enough that the two panels read as parallel curves on different scales.
Main takeaway from the visual
Stablecoin volume rose in step with the broader crypto market rather than following an unrelated path. The two panels share the same acceleration into 2021 and the same retreat afterward, which makes the stablecoin market look tightly tied to exchange-trading activity.
Key standout values or extremes
The cryptocurrency panel peaks around the 2,300-billion-dollar range in 2021 before falling back, while the stablecoin panel peaks around the mid-700-billion-dollar range before easing lower. In both panels, the largest moves arrive late in the timeline, after a much flatter 2018 to 2020 period.
Controls / sequence, when applicable
This is a static chart image with no in-chart controls to operate.
Companion media, when applicable
There is no separate companion audio or video; the chart image is the full visual on this page.