Source page: McKinsey & Company
Commentary
Curb your crisis: Preparing for risk today can prevent disaster tomorrow
Risk | Strategy
December 16, 2020 – We looked at three potential crisis scenarios across three sectors and found that pairs of companies with much—but not everything—in common could view the same risk differently. Brand identity and supply-chain resilience are most affected across the grid.
To read the article, see “The disaster you could have stopped: Preparing for extraordinary risks,” December 15, 2020.
customizer here
Visual form
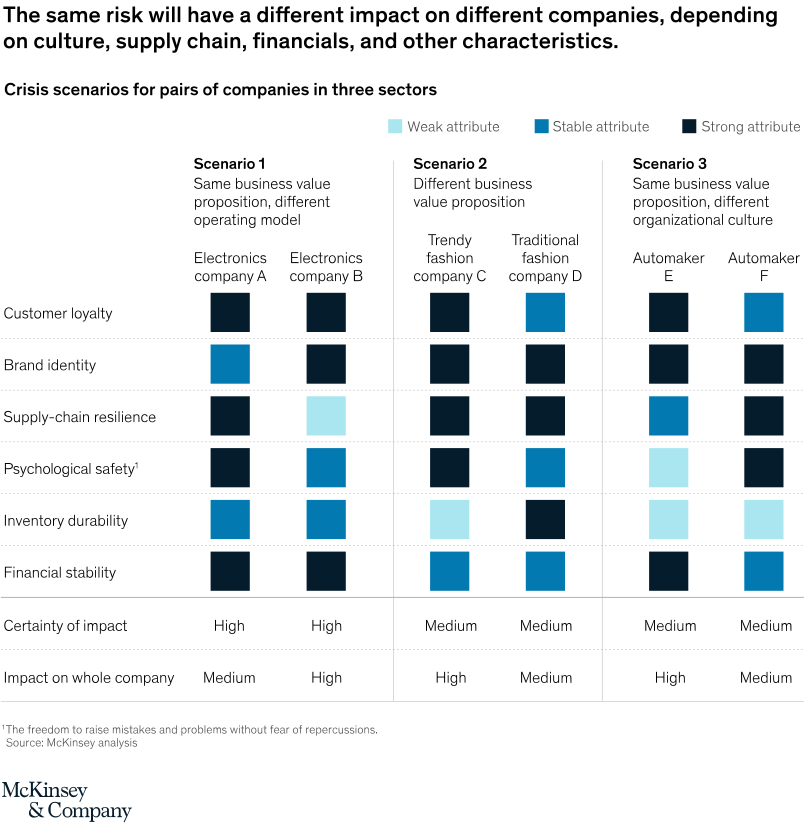
Scenario attribute matrix.
Layout / body structure
The chart is a table-like matrix divided into three scenario columns, each comparing a pair of companies within a sector. Read each scenario from top to bottom across the listed attributes, then compare left company versus right company before moving to the next scenario.
What is being compared
The chart compares how the same crisis risk can affect paired companies differently depending on operating model, business value proposition, or organizational culture. It does that across six attributes, including customer loyalty, brand identity, supply-chain resilience, psychological safety, inventory durability, and financial stability.
Measurement system
The chart is categorical rather than numeric. Each square is color coded as weak, stable, or strong attribute, and the bottom rows summarize certainty of impact and whole-company impact for each company pair.
Visible structure inside the graphic
Three scenario blocks span the page: electronics companies A and B, trendy fashion company C versus traditional fashion company D, and automaker E versus automaker F. Within each block, colored squares mark the strength of the six attributes, and the final two rows state the certainty and whole-company impact levels such as high or medium.
Main takeaway from the visual
Different combinations of company attributes produce meaningfully different crisis outcomes even when companies face the same external shock. The contrasting square patterns within each pair make it clear that resilience depends on internal configuration, not just industry exposure.
Key standout values or extremes
Scenario 1 shows the strongest divergence in whole-company impact, with Electronics company B marked high and company A marked medium despite facing the same business-value proposition. Scenario 3 shows especially sharp differences in psychological safety and financial stability between the two automakers, while Scenario 2 contrasts weak inventory durability for trendy fashion company C against stronger inventory durability for traditional fashion company D.
Controls / sequence, when applicable
This is a static chart image with no in-chart controls to operate.
Companion media, when applicable
There is no separate companion audio or video; the chart image is the full visual on this page.